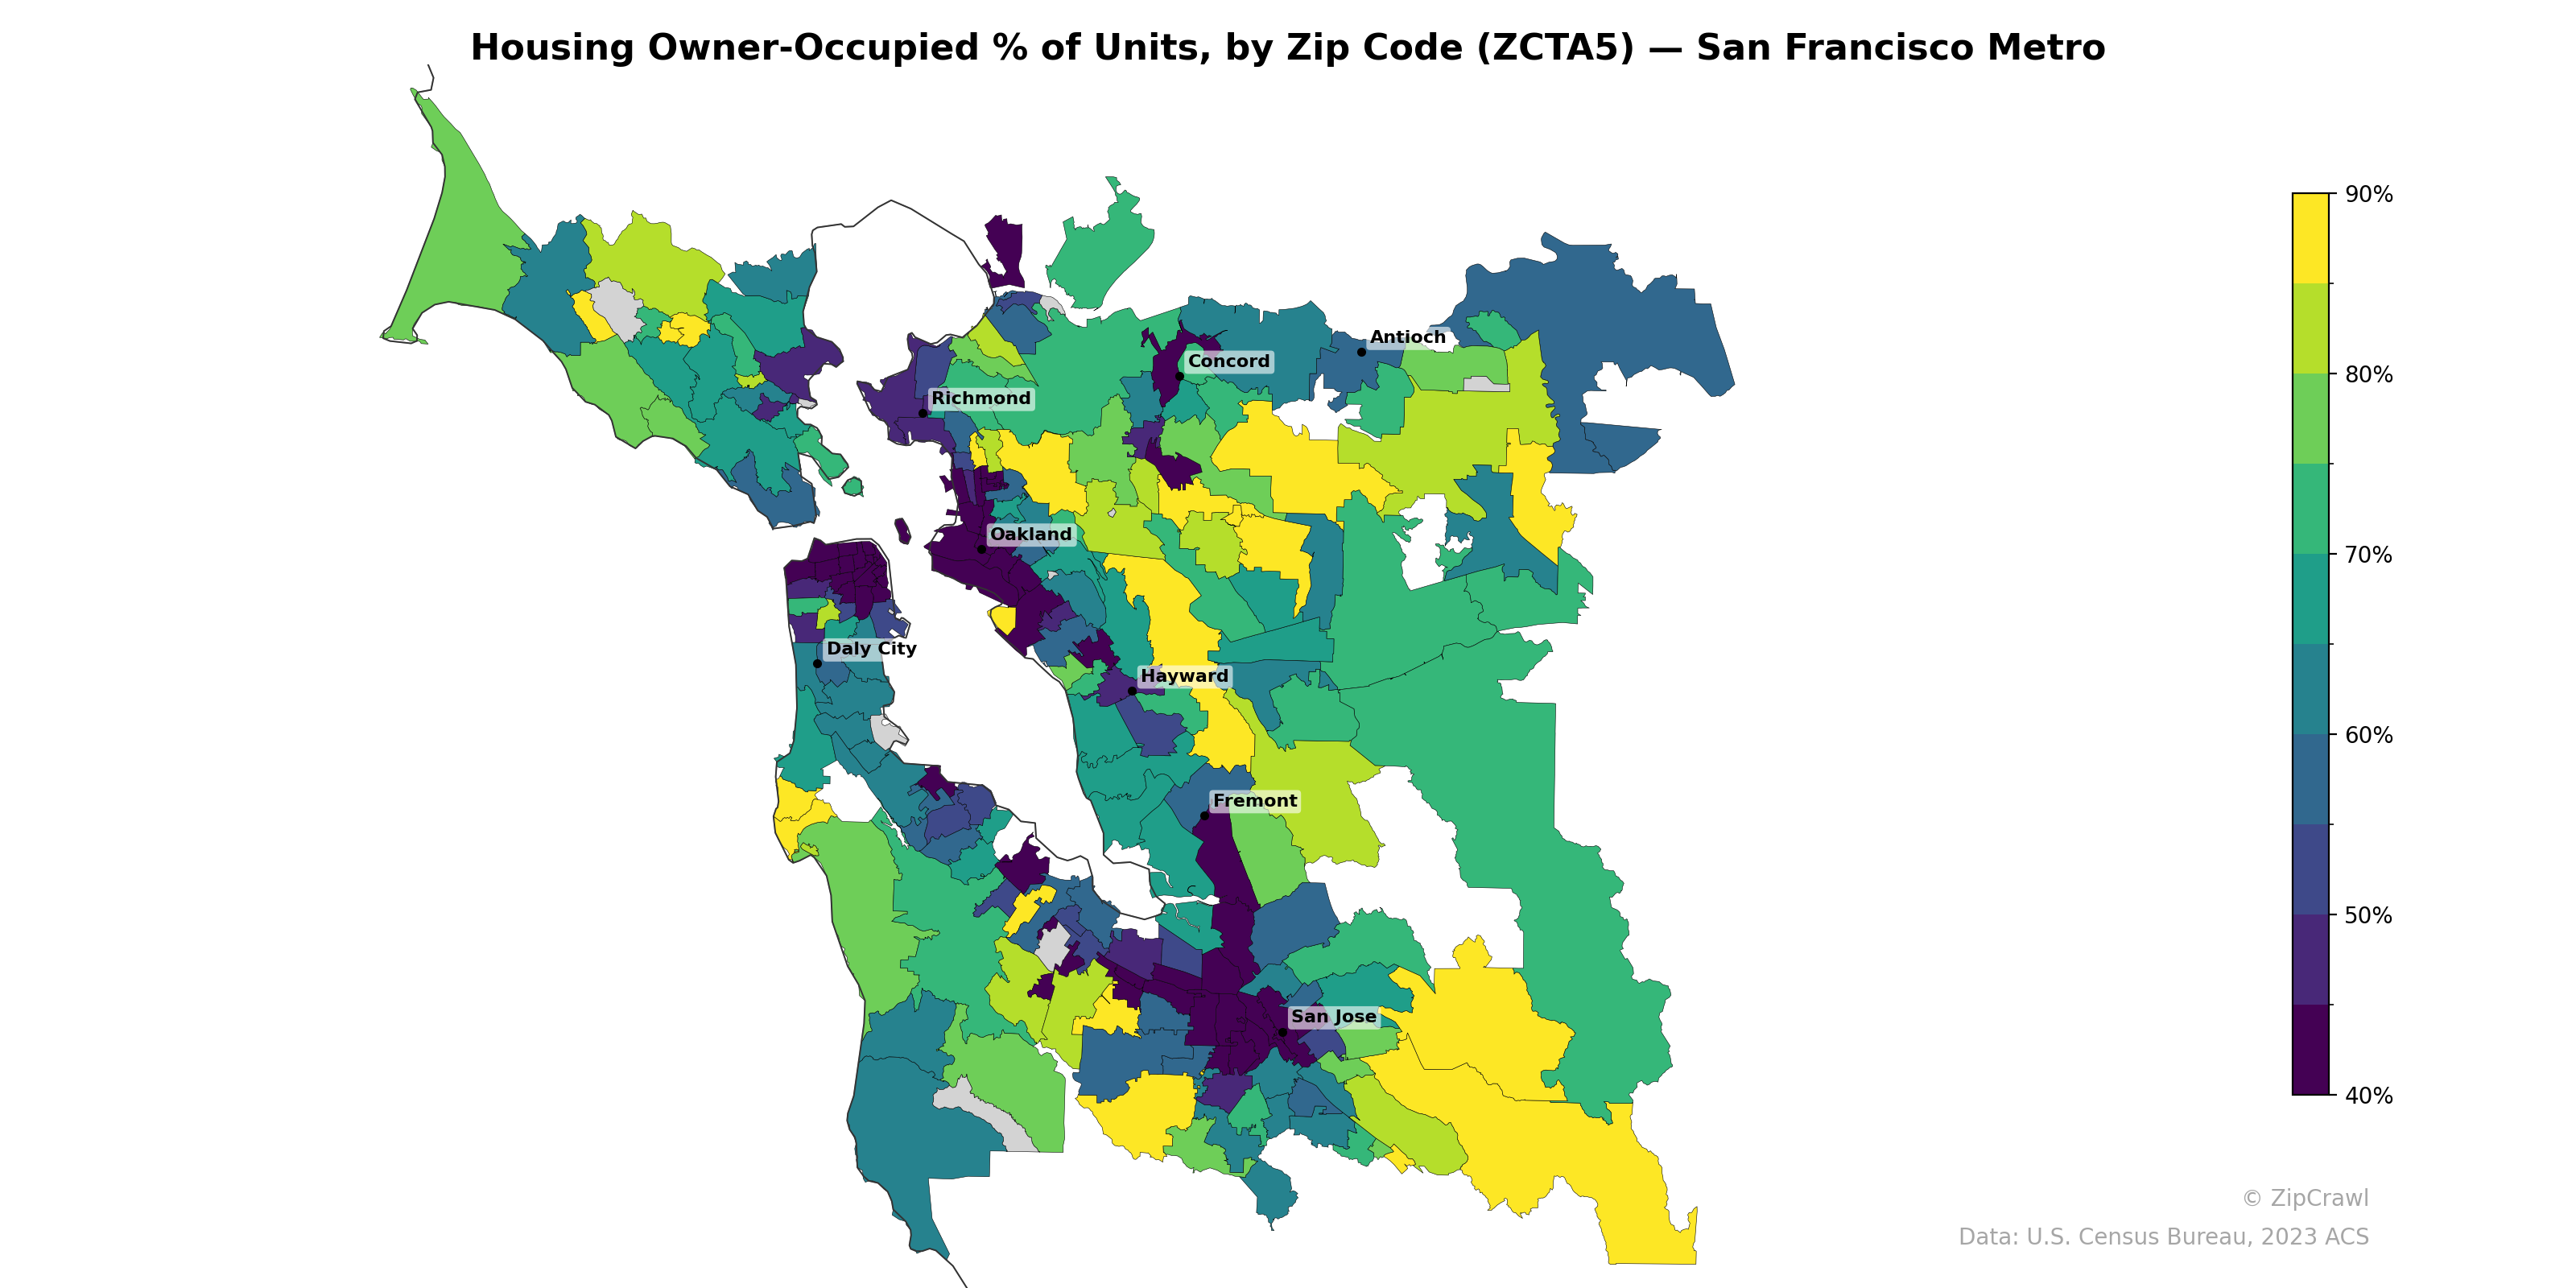
NOTE: Gray indicates insufficient data or a suppressed estimate.
Owner-occupancy rates in the San Francisco metro area exhibit a clear urban-suburban divide, with the lowest concentrations (below 40–50%) clustered along the dense urban corridor stretching from San Francisco through Daly City and into central Oakland and downtown San Jose. Suburban and exurban zip codes to the east—particularly around Antioch, eastern Concord, and the outer reaches of Fremont and San Jose—display markedly higher owner-occupancy rates, frequently exceeding 80–90%. The Peninsula communities between Daly City and San Jose show a patchwork pattern, with pockets of high renter concentration near transit corridors interspersed with predominantly owner-occupied residential neighborhoods.
Data: U.S. Census Bureau, 2023 ACS
Explore
- Household Median Income by Zip Code (ZCTA5) — Chicago Metro
- Housing % of Units Built Since 2010, by Zip Code (ZCTA5) — San Francisco Metro
- % of Households with Broadband Internet, by Zip Code (ZCTA5) — San Francisco Metro
- Household Average Size by Zip Code (ZCTA5) — San Francisco Metro
- Housing Owner-Occupied Median Value ($), by Zip Code (ZCTA5) — San Francisco Metro
- Housing Median Monthly Rent ($), by Zip Code (ZCTA5) — San Francisco Metro
- Married Couple (% of all Households) by Zip Code (ZCTA5) — San Francisco Metro
- Bachelor's Degree or Higher (% of Over 25) by Zip Code (ZCTA5) — San Francisco Metro
- % of Population without Health Insurance, by Zip Code (ZCTA5) — San Francisco Metro
- Housing Vacancy Rate by Zip Code (ZCTA5) — San Francisco Metro
- % of Population on Food Stamps or SNAP (Last 12 Months), by Zip Code (ZCTA5) — Wyoming
- % of Population without Health Insurance, by County
- % of Population on Food Stamps or SNAP (Last 12 Months), by Zip Code (ZCTA5) — Los Angeles Metro
- Population Non-Hispanic Asian % by Zip Code (ZCTA5) — Los Angeles Metro
- Median Age by Zip Code (ZCTA5) — Chicago Metro
- Population Hispanic % by Zip Code (ZCTA5) — Chicago Metro
- Population Non-Hispanic Black % by Zip Code (ZCTA5) — Chicago Metro
- Housing Owner-Occupied Median Value ($), by Zip Code (ZCTA5) — New York Metro
- Population Non-Hispanic American Indian % by Zip Code (ZCTA5) — Chicago Metro
- High School Graduate (% of Over 25) by Zip Code (ZCTA5) — Chicago Metro
- Population Non-Hispanic White % by Zip Code (ZCTA5) — Chicago Metro
- U.S. Citizens (% of Population Over 18) by Zip Code (ZCTA5) — Chicago Metro
- Housing Owner-Occupied Median Value ($), by Zip Code (ZCTA5) — Boston Metro
- % of Households with Broadband Internet, by Zip Code (ZCTA5) — Boston Metro
- Housing Median Monthly Rent ($), by Zip Code (ZCTA5) — Boston Metro
- Population Non-Hispanic White % by Zip Code (ZCTA5) — Boston Metro
- Population Non-Hispanic American Indian % by Zip Code (ZCTA5) — Boston Metro
- Bachelor's Degree or Higher (% of Over 25) by Zip Code (ZCTA5) — Boston Metro
- % of Population without Health Insurance, by Zip Code (ZCTA5) — Boston Metro
- Median Age by Zip Code (ZCTA5) — Boston Metro
- Housing Owner-Occupied % of Units, by Zip Code (ZCTA5) — San Diego Metro
- Housing Owner-Occupied % of Units, by Zip Code (ZCTA5) — San Antonio Metro
- Housing Owner-Occupied % of Units, by Zip Code (ZCTA5) — Houston Metro
- Housing Owner-Occupied % of Units, by Zip Code (ZCTA5) — Miami Metro
- Housing Owner-Occupied % of Units, by Zip Code (ZCTA5) — Seattle Metro
- Housing Owner-Occupied % of Units, by Zip Code (ZCTA5) — Tampa Metro
- Housing Owner-Occupied % of Units, by Zip Code (ZCTA5) — Boston Metro
- Housing Owner-Occupied % of Units, by Zip Code (ZCTA5) — Detroit Metro
- Housing Owner-Occupied % of Units, by Zip Code (ZCTA5) — Denver Metro
- Housing Owner-Occupied % of Units, by Zip Code (ZCTA5) — St. Louis Metro