NOTE: Gray indicates insufficient data or a suppressed estimate.
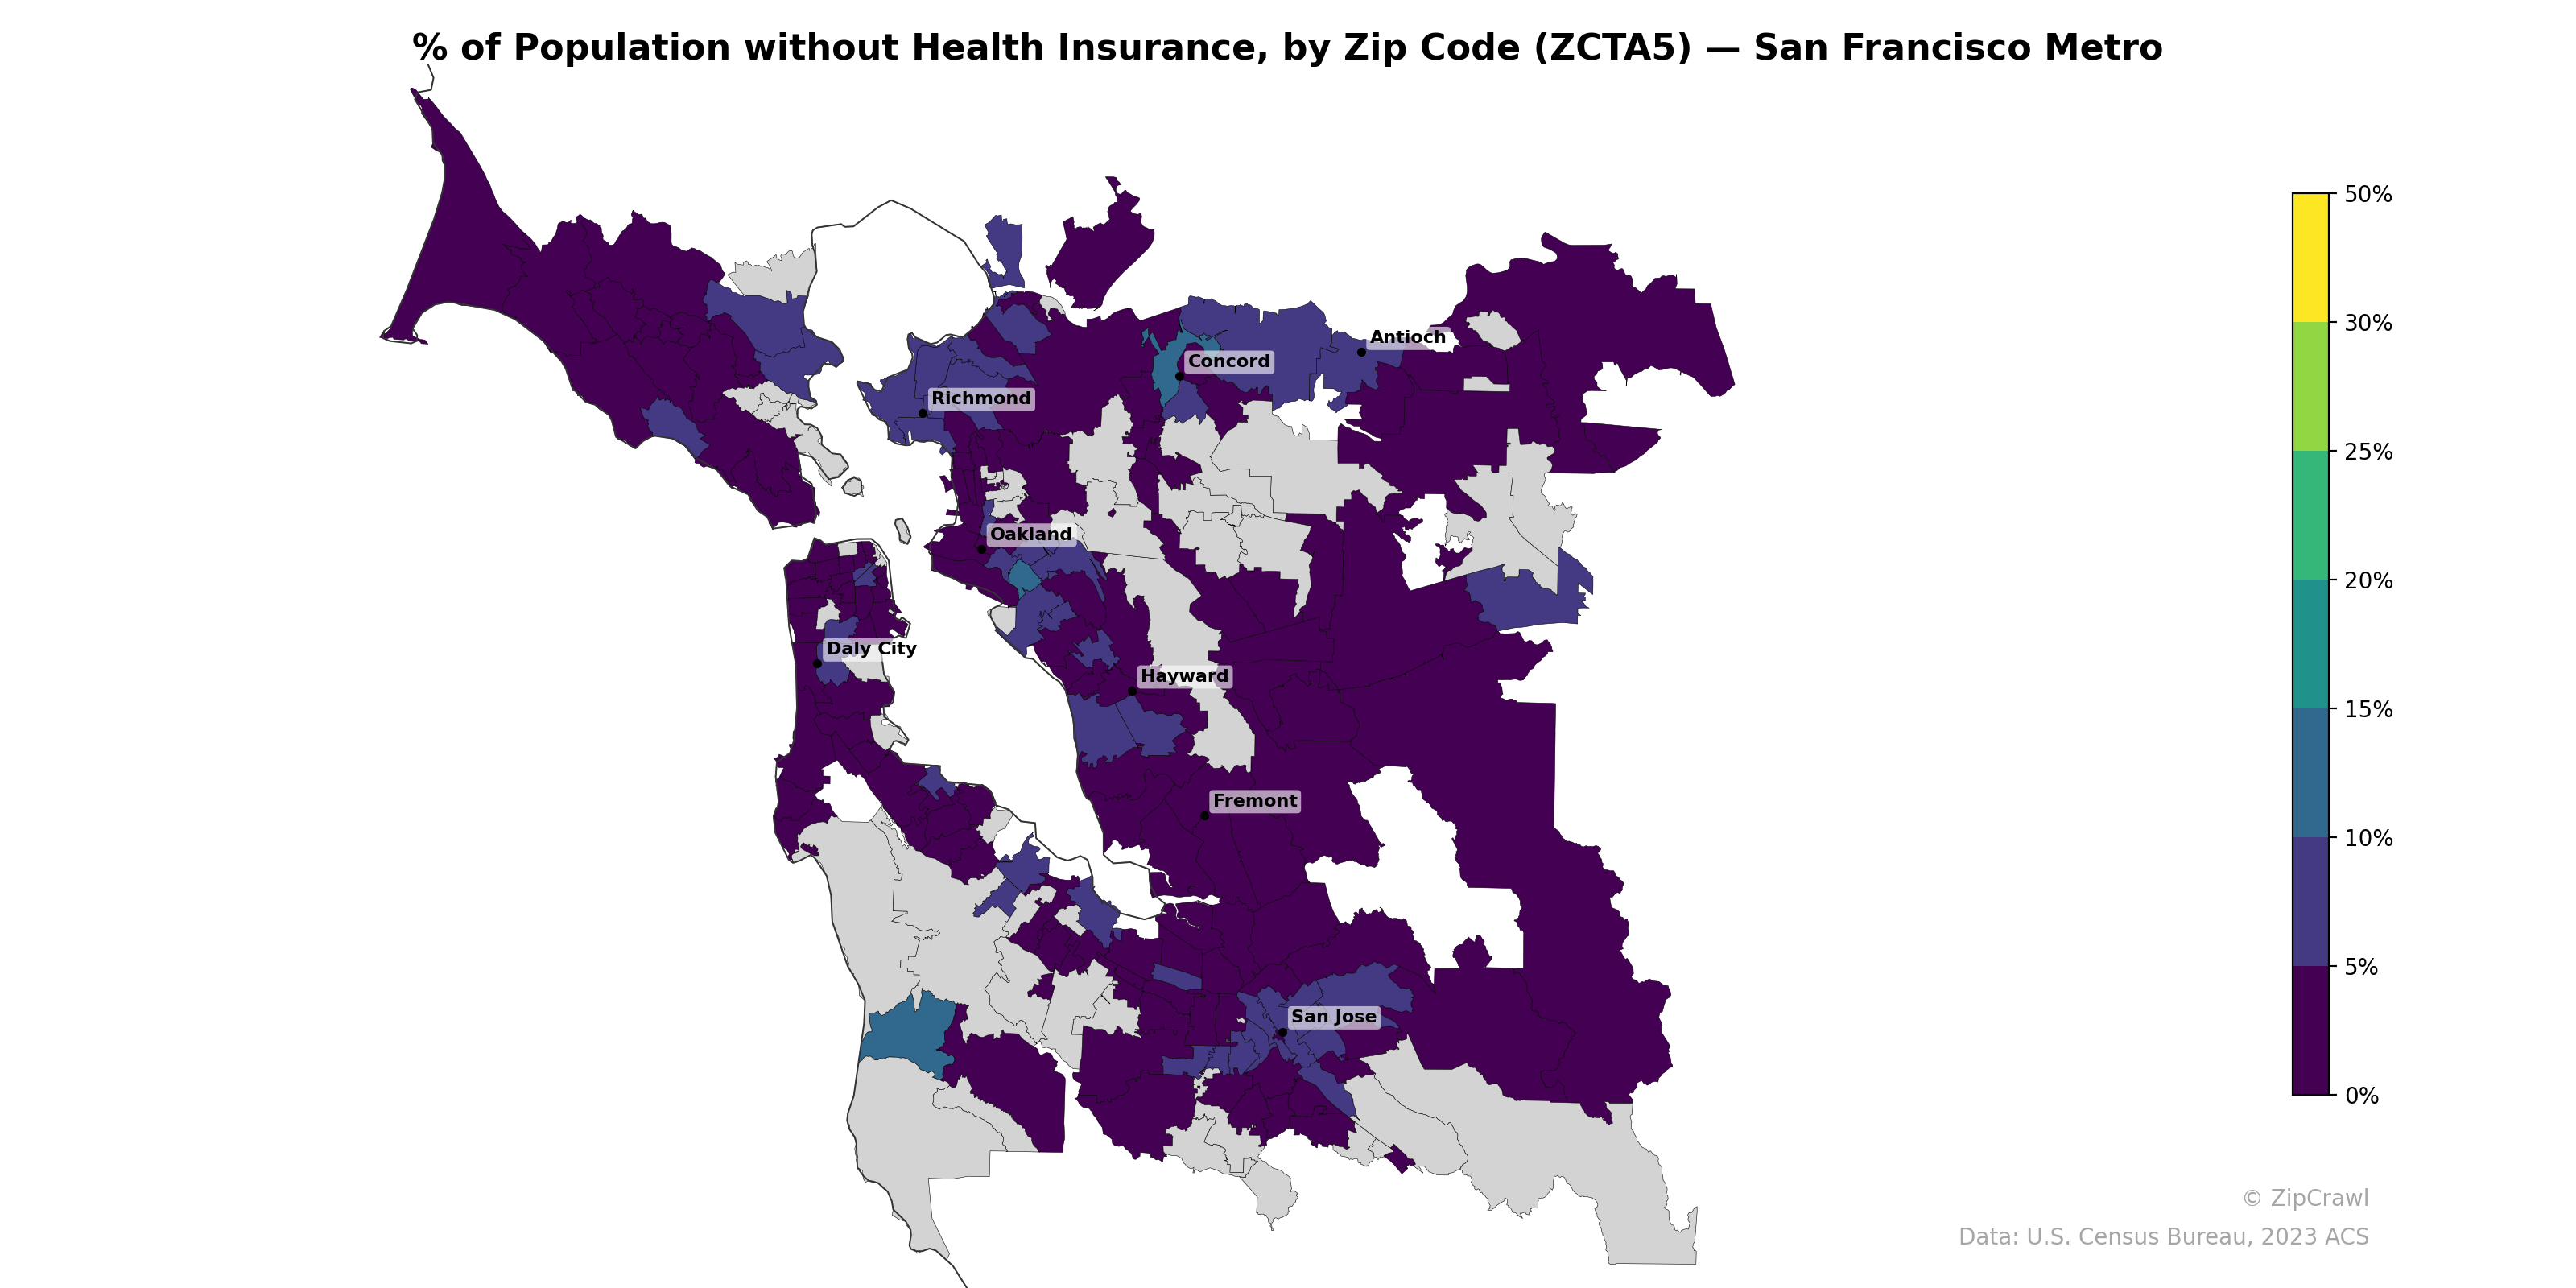
Zip codes in the southern and eastern portions of the metro—particularly around San Jose, East San Jose, and parts of Hayward—exhibit notably higher uninsured rates, often exceeding 10–15%, while affluent coastal and suburban areas west of the bay and in the central peninsula consistently fall below 5%. A striking contrast emerges between the low-uninsured corridors of central San Francisco, much of Marin County, and the wealthier East Bay suburbs versus the elevated rates clustered in working-class urban cores like Richmond, East Oakland, and pockets of Antioch. The geographic pattern closely mirrors known income and immigration disparities across the metro, with the highest uninsured concentrations forming an arc along the eastern and southern margins of the region.
Data: U.S. Census Bureau, 2023 ACS
Explore
- Household Median Income by Zip Code (ZCTA5) — Chicago Metro
- Married Couple (% of all Households) by Zip Code (ZCTA5) — San Francisco Metro
- Bachelor's Degree or Higher (% of Over 25) by Zip Code (ZCTA5) — San Francisco Metro
- Housing % of Units Built Since 2010, by Zip Code (ZCTA5) — San Francisco Metro
- Housing Vacancy Rate by Zip Code (ZCTA5) — San Francisco Metro
- Housing Owner-Occupied % of Units, by Zip Code (ZCTA5) — San Francisco Metro
- Housing Median Monthly Rent ($), by Zip Code (ZCTA5) — San Francisco Metro
- Housing Owner-Occupied Median Value ($), by Zip Code (ZCTA5) — San Francisco Metro
- % of Households with Broadband Internet, by Zip Code (ZCTA5) — San Francisco Metro
- Household Average Size by Zip Code (ZCTA5) — San Francisco Metro
- Population Non-Hispanic Asian % by Zip Code (ZCTA5) — Wyoming
- Population Non-Hispanic White % by Zip Code (ZCTA5) — Chicago Metro
- Median Age by Zip Code (ZCTA5) — Chicago Metro
- U.S. Citizens (% of Population Over 18) by Zip Code (ZCTA5) — Chicago Metro
- % of Population on Food Stamps or SNAP (Last 12 Months), by Zip Code (ZCTA5) — Los Angeles Metro
- Population Non-Hispanic American Indian % by Zip Code (ZCTA5) — Chicago Metro
- Population Non-Hispanic Black % by Zip Code (ZCTA5) — Chicago Metro
- High School Graduate (% of Over 25) by Zip Code (ZCTA5) — Chicago Metro
- Population Non-Hispanic Asian % by Zip Code (ZCTA5) — Los Angeles Metro
- Population Hispanic % by Zip Code (ZCTA5) — Chicago Metro
- Housing % of Units Built Since 2010, by Zip Code (ZCTA5) — Boston Metro
- Housing Owner-Occupied Median Value ($), by Zip Code (ZCTA5) — Boston Metro
- Household Average Size by Zip Code (ZCTA5) — Boston Metro
- Population Non-Hispanic Black % by Zip Code (ZCTA5) — Boston Metro
- Population Hispanic % by Zip Code (ZCTA5) — Boston Metro
- Population Non-Hispanic American Indian % by Zip Code (ZCTA5) — Boston Metro
- % of Households with Broadband Internet, by Zip Code (ZCTA5) — Boston Metro
- Housing Owner-Occupied % of Units, by Zip Code (ZCTA5) — Boston Metro
- Housing Median Monthly Rent ($), by Zip Code (ZCTA5) — Boston Metro
- Median Age by Zip Code (ZCTA5) — Boston Metro
- % of Population without Health Insurance, by Zip Code (ZCTA5) — San Diego Metro
- % of Population without Health Insurance, by Zip Code (ZCTA5) — San Antonio Metro
- % of Population without Health Insurance, by Zip Code (ZCTA5) — Boston Metro
- % of Population without Health Insurance, by Zip Code (ZCTA5) — Miami Metro
- % of Population without Health Insurance, by Zip Code (ZCTA5) — Houston Metro
- % of Population without Health Insurance, by Zip Code (ZCTA5) — Seattle Metro
- % of Population without Health Insurance, by Zip Code (ZCTA5) — Detroit Metro
- % of Population without Health Insurance, by Zip Code (ZCTA5) — Tampa Metro
- % of Population without Health Insurance, by Zip Code (ZCTA5) — St. Louis Metro
- % of Population without Health Insurance, by Zip Code (ZCTA5) — Chicago Metro