NOTE: Gray indicates insufficient data or a suppressed estimate.
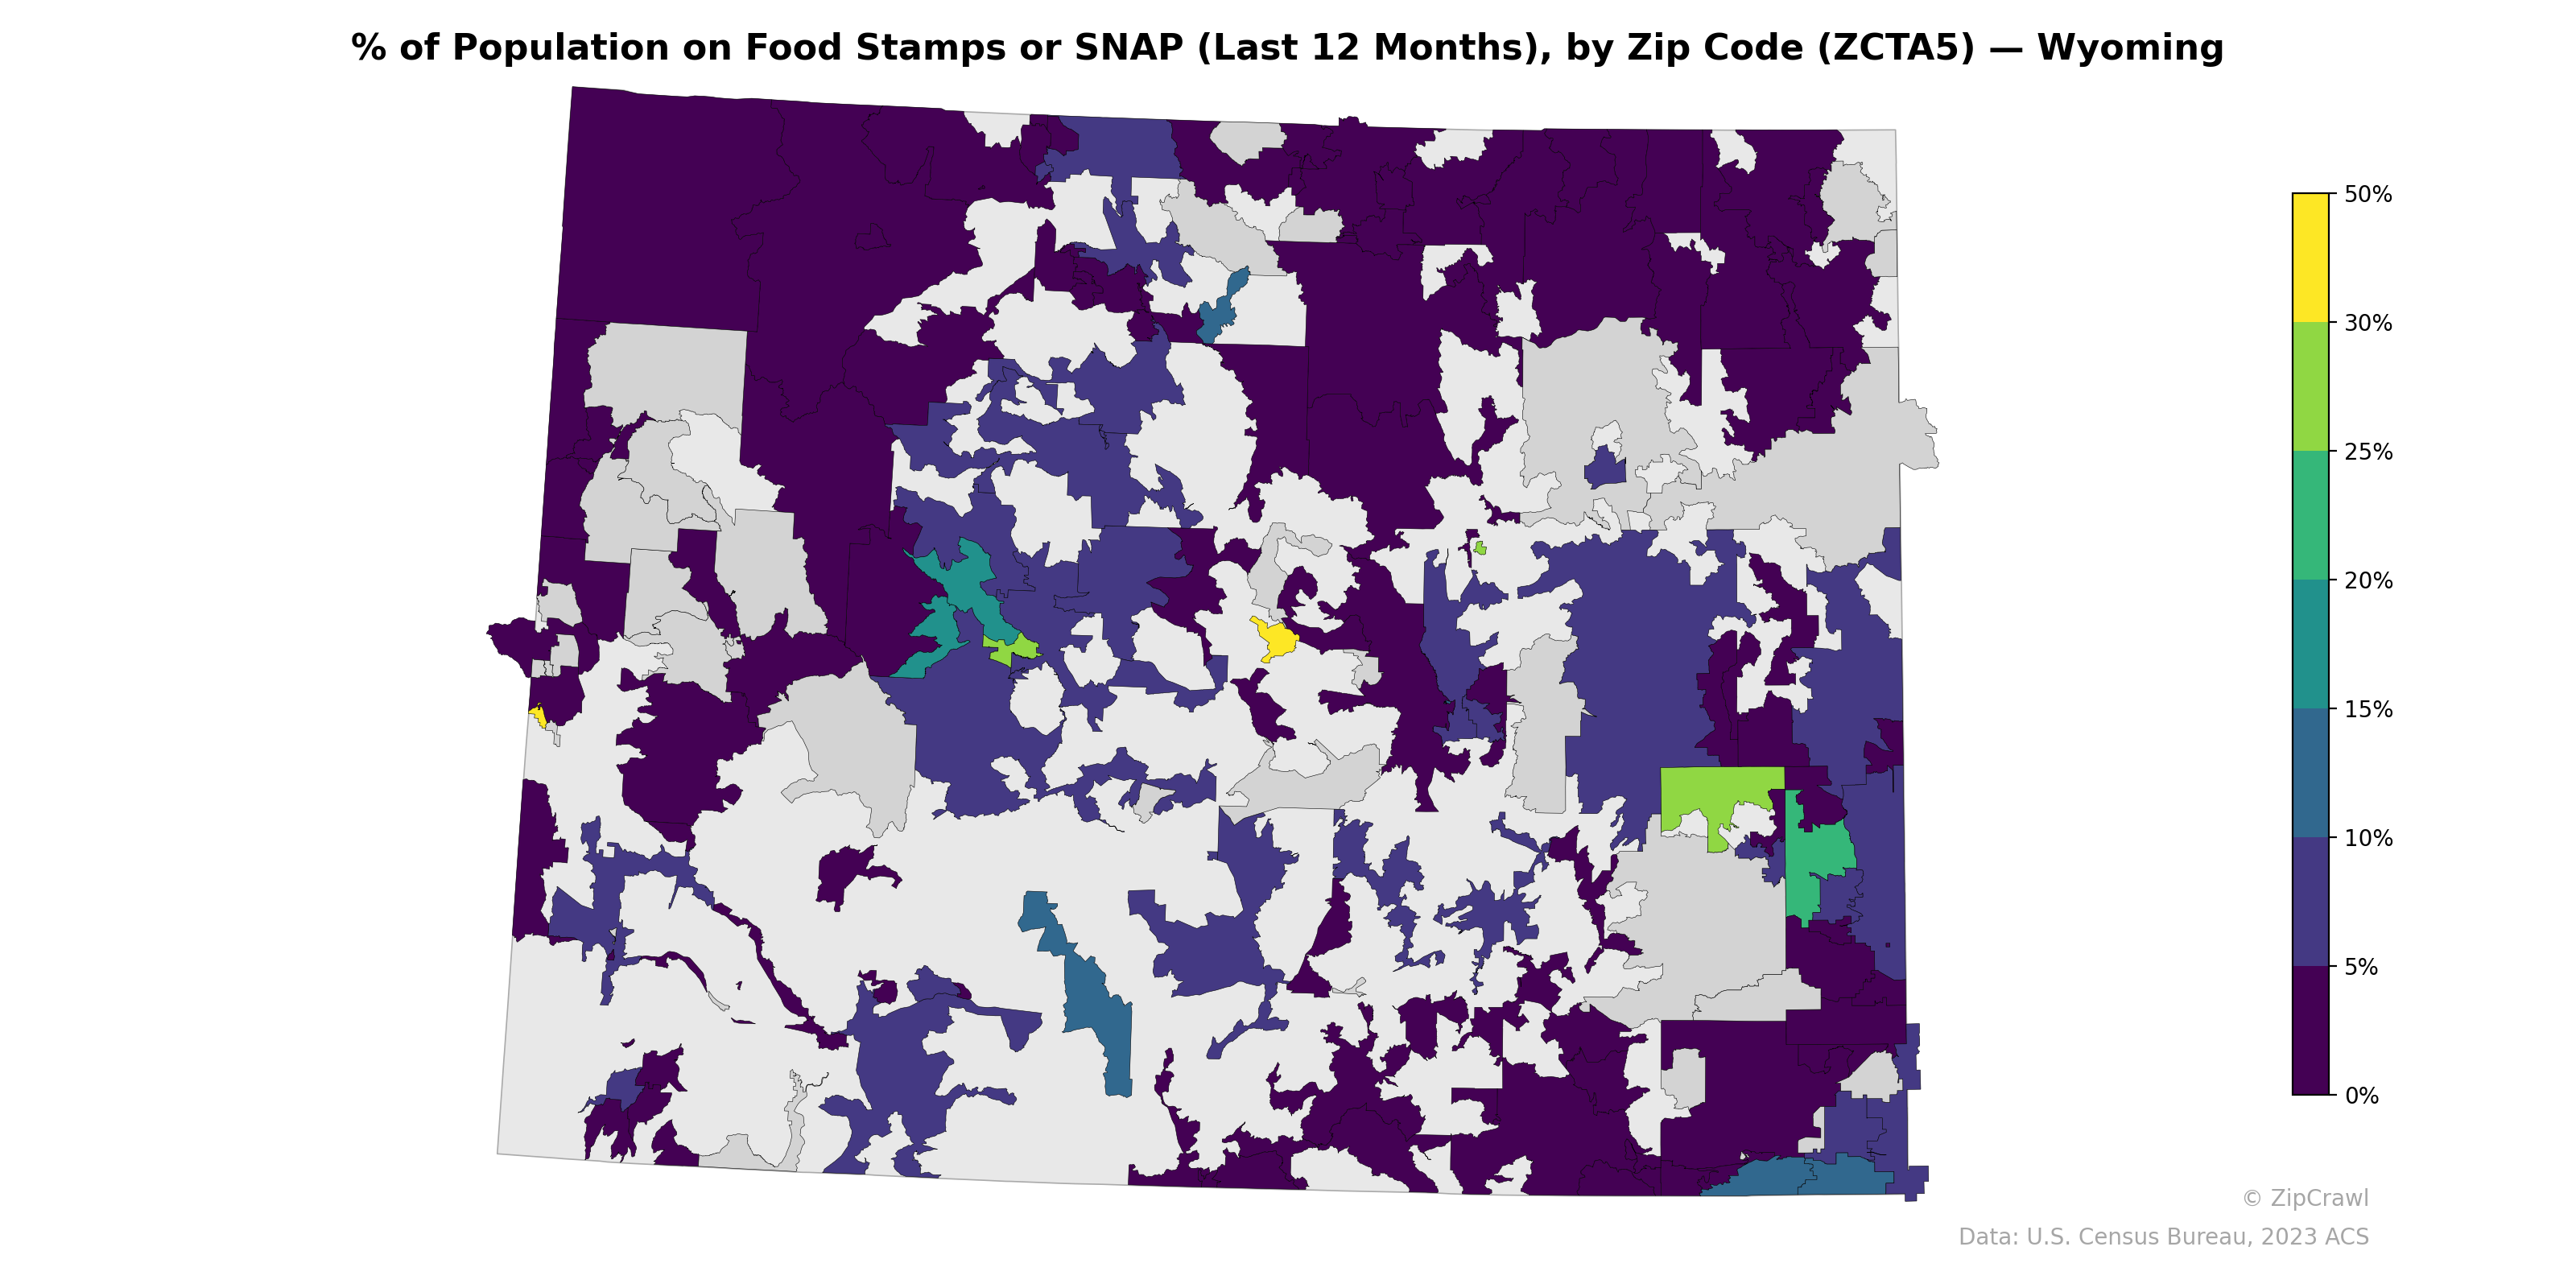
SNAP participation rates across Wyoming zip codes display considerable geographic variation, with the highest concentrations (approaching 25-30%) clustered in the Wind River Reservation area in the west-central part of the state and scattered pockets along the northern border. Much of southeastern and south-central Wyoming exhibits moderate usage rates in the 5-10% range, while many rural and suburban zip codes, particularly in the western mountain regions and areas surrounding more affluent communities, report near-zero participation shown in gray or light shading. A notable bright green outlier in the east-central portion of the state, likely near the Cheyenne or Laramie County area, stands out with elevated SNAP rates exceeding 25%, contrasting sharply with surrounding lower-participation zones.
Data: U.S. Census Bureau, 2023 ACS
Explore
- Household Median Income by Zip Code (ZCTA5) — Illinois
- U.S. Citizens (% of Population Over 18) by Zip Code (ZCTA5) — Washington D.C.
- Household Median Income by Zip Code (ZCTA5) — Washington D.C.
- Housing Vacancy Rate by Zip Code (ZCTA5) — Wyoming
- Population Hispanic % by Zip Code (ZCTA5) — Washington D.C.
- Population Non-Hispanic Black % by Zip Code (ZCTA5) — Washington D.C.
- Population Non-Hispanic Asian % by Zip Code (ZCTA5) — Wyoming
- Population Non-Hispanic White % by Zip Code (ZCTA5) — Washington D.C.
- Median Age by Zip Code (ZCTA5) — Washington D.C.
- Married Couple (% of all Households) by Zip Code (ZCTA5) — Wyoming
- Married Couple (% of all Households) by County
- Population Non-Hispanic Black % by Zip Code (ZCTA5) — Illinois
- High School Graduate (% of Over 25) by Zip Code (ZCTA5) — Illinois
- Population Non-Hispanic American Indian % by Zip Code (ZCTA5) — Illinois
- Housing Owner-Occupied % of Units, by Zip Code (ZCTA5) — San Francisco Metro
- Median Age by Zip Code (ZCTA5) — Illinois
- Housing Owner-Occupied % of Units, by Zip Code (ZCTA5) — Florida
- U.S. Citizens (% of Population Over 18) by Zip Code (ZCTA5) — Illinois
- Population Non-Hispanic White % by Zip Code (ZCTA5) — Illinois
- Population Hispanic % by Zip Code (ZCTA5) — Illinois
- Population Non-Hispanic Asian % by Zip Code (ZCTA5) — New York
- Housing Vacancy Rate by Zip Code (ZCTA5) — Vermont
- Bachelor's Degree or Higher (% of Over 25) by Zip Code (ZCTA5) — Vermont
- Population Non-Hispanic Asian % by Zip Code (ZCTA5) — Vermont
- % of Households with Broadband Internet, by Zip Code (ZCTA5) — Vermont
- Married Couple (% of all Households) by Zip Code (ZCTA5) — Vermont
- High School Graduate (% of Over 25) by Zip Code (ZCTA5) — Vermont
- % of Households with Broadband Internet, by Zip Code (ZCTA5) — Oregon
- Population Non-Hispanic American Indian % by Zip Code (ZCTA5) — Vermont
- U.S. Citizens (% of Population Over 18) by Zip Code (ZCTA5) — Wyoming
- % of Population on Food Stamps or SNAP (Last 12 Months), by Zip Code (ZCTA5) — Ohio
- % of Population on Food Stamps or SNAP (Last 12 Months), by Zip Code (ZCTA5) — Oregon
- % of Population on Food Stamps or SNAP (Last 12 Months), by Zip Code (ZCTA5) — Montana
- % of Population on Food Stamps or SNAP (Last 12 Months), by Zip Code (ZCTA5) — Iowa
- % of Population on Food Stamps or SNAP (Last 12 Months), by Zip Code (ZCTA5) — Utah
- % of Population on Food Stamps or SNAP (Last 12 Months), by Zip Code (ZCTA5) — Maine
- % of Population on Food Stamps or SNAP (Last 12 Months), by Zip Code (ZCTA5) — Washington
- % of Population on Food Stamps or SNAP (Last 12 Months), by Zip Code (ZCTA5) — Idaho
- % of Population on Food Stamps or SNAP (Last 12 Months), by Zip Code (ZCTA5) — Texas
- % of Population on Food Stamps or SNAP (Last 12 Months), by Zip Code (ZCTA5) — Alaska