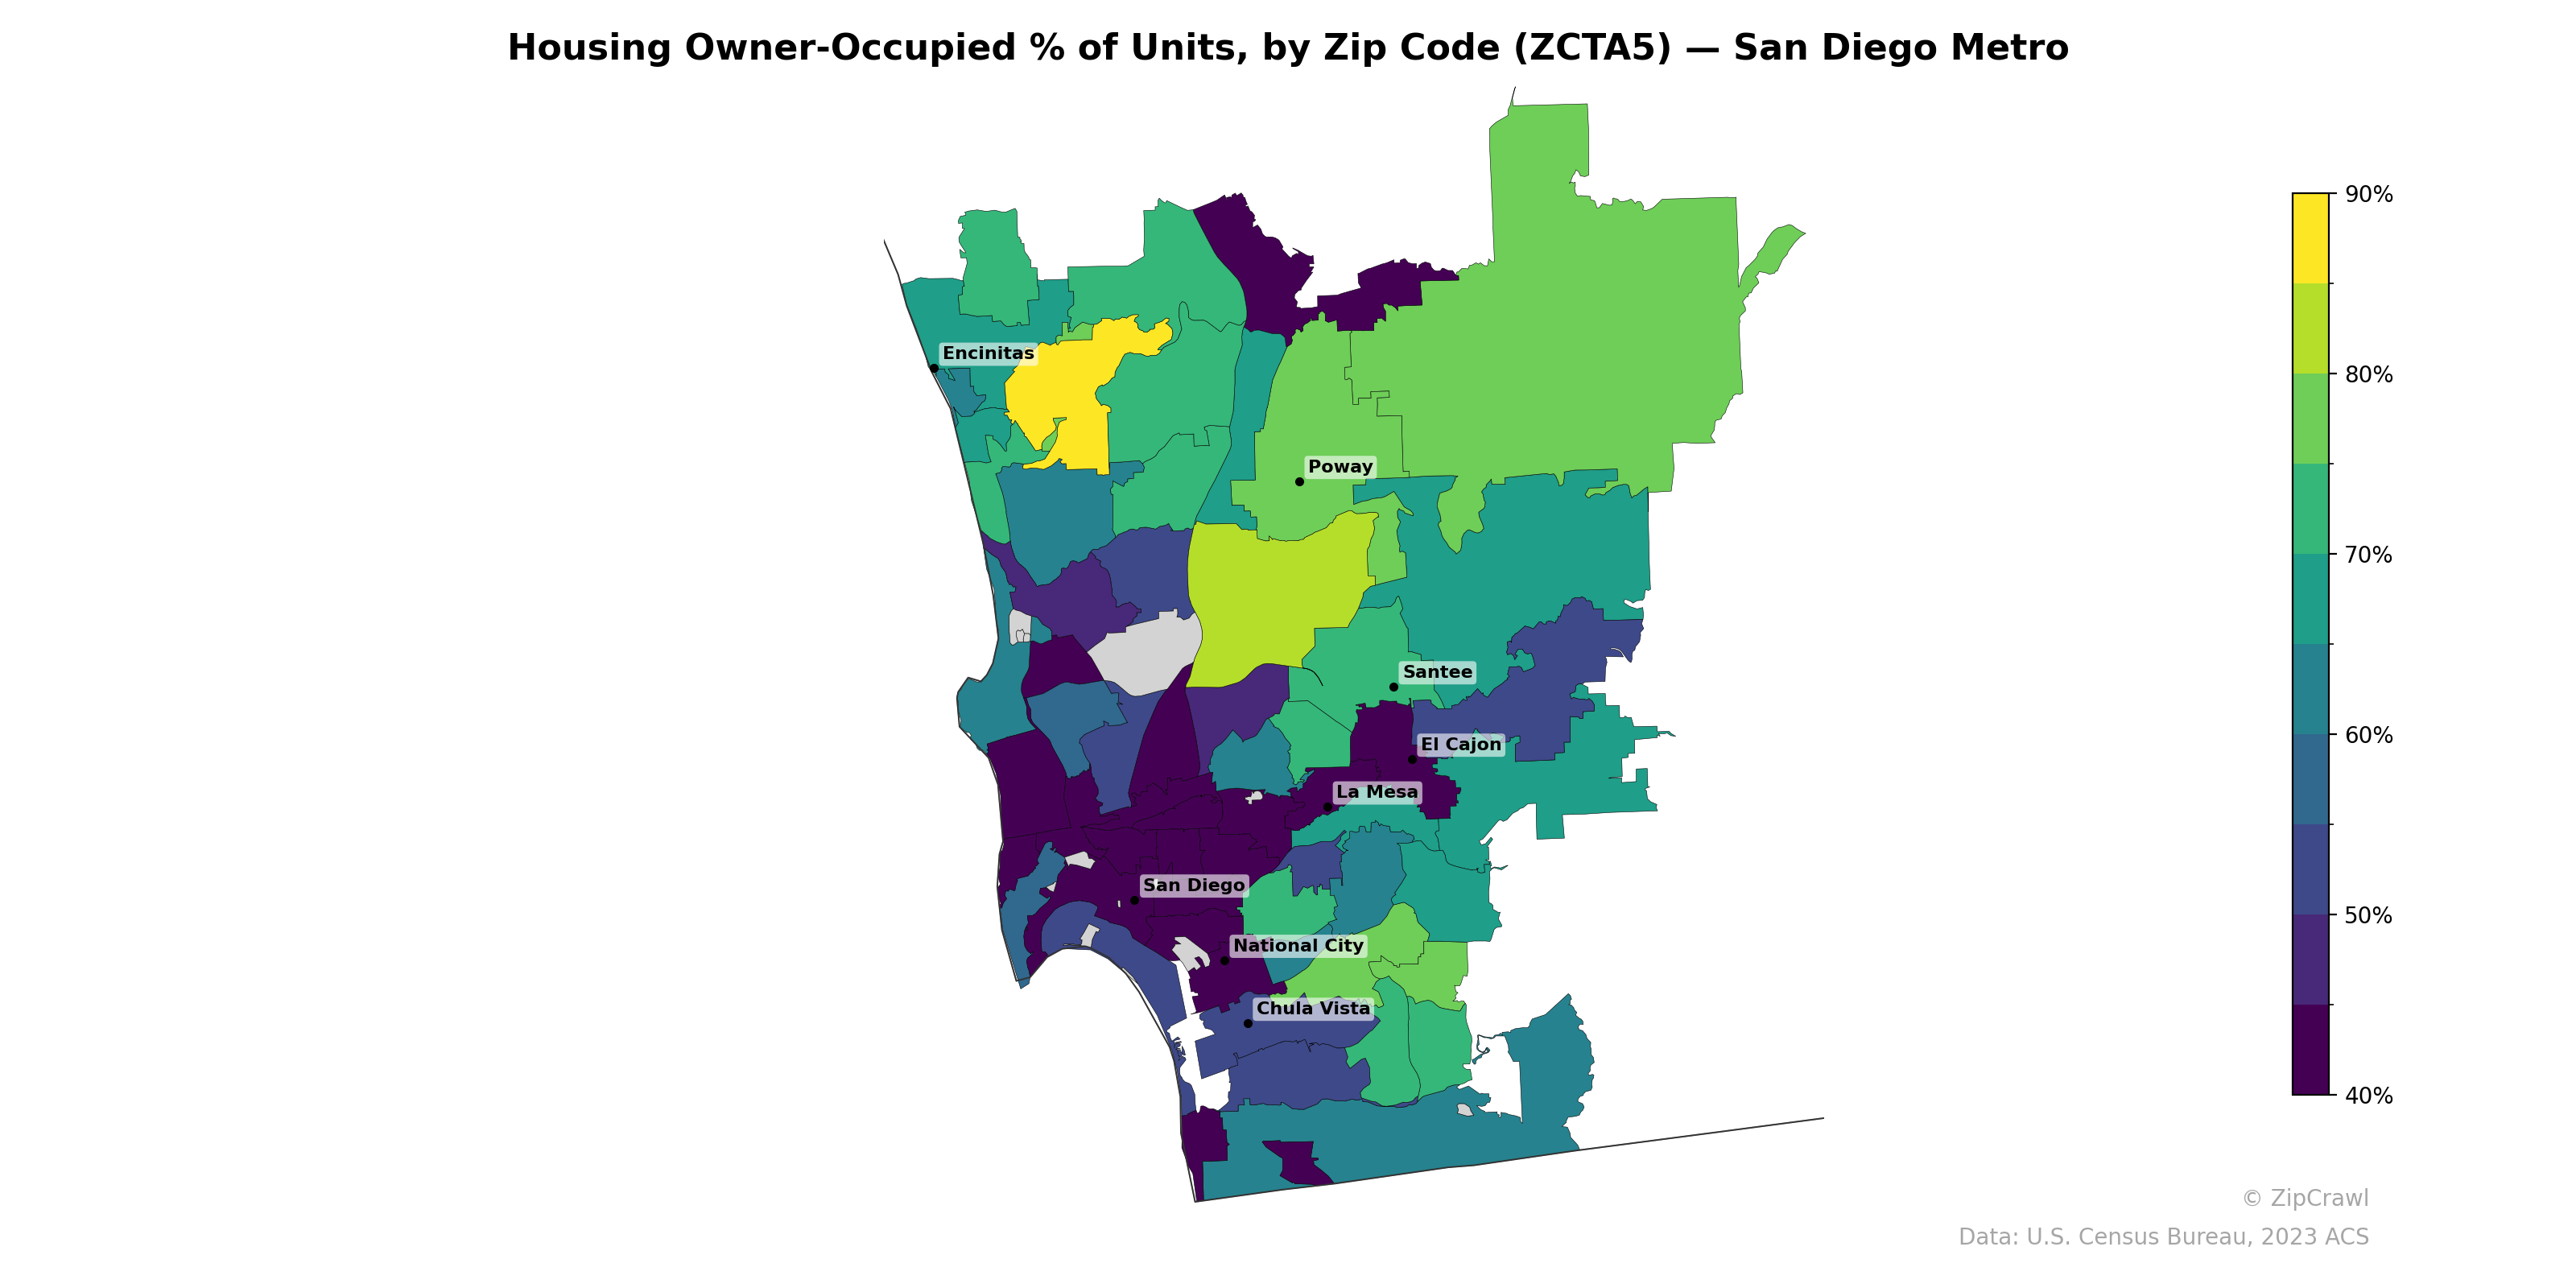
NOTE: Gray indicates insufficient data or a suppressed estimate.
Owner-occupancy rates in the San Diego metro exhibit a clear inland-versus-coastal gradient, with the highest concentrations (above 80%) clustered in the northeastern suburbs near Poway and the large eastern zip codes, while Encinitas stands out as a notable coastal exception with similarly elevated homeownership. The urban core around downtown San Diego, National City, and several coastal zip codes south of La Jolla register the lowest owner-occupancy rates, generally below 45%, reflecting dense rental-heavy housing stock. A belt of moderate ownership (55–70%) runs through the mid-county areas connecting El Cajon, Santee, and La Mesa, serving as a transitional zone between the high-ownership exurbs and the renter-dominated urban center.
Data: U.S. Census Bureau, 2023 ACS
Explore
- Married Couple (% of all Households) by Zip Code (ZCTA5) — San Diego Metro
- Housing Median Monthly Rent ($), by Zip Code (ZCTA5) — San Diego Metro
- % of Households with Broadband Internet, by Zip Code (ZCTA5) — San Diego Metro
- Housing % of Units Built Since 2010, by Zip Code (ZCTA5) — San Diego Metro
- Household Average Size by Zip Code (ZCTA5) — San Diego Metro
- % of Population without Health Insurance, by Zip Code (ZCTA5) — San Diego Metro
- Housing Owner-Occupied Median Value ($), by Zip Code (ZCTA5) — San Diego Metro
- Housing Vacancy Rate by Zip Code (ZCTA5) — San Diego Metro
- Bachelor's Degree or Higher (% of Over 25) by Zip Code (ZCTA5) — San Diego Metro
- Population Non-Hispanic American Indian % by County
- Housing Vacancy Rate by Zip Code (ZCTA5) — Chicago Metro
- Married Couple (% of all Households) by Zip Code (ZCTA5) — Chicago Metro
- Housing Owner-Occupied Median Value ($), by Zip Code (ZCTA5) — Chicago Metro
- Household Average Size by Zip Code (ZCTA5) — Chicago Metro
- Housing % of Units Built Since 2010, by Zip Code (ZCTA5) — Chicago Metro
- % of Households with Broadband Internet, by Zip Code (ZCTA5) — Chicago Metro
- Housing Owner-Occupied Median Value ($), by Zip Code (ZCTA5) — New York Metro
- Bachelor's Degree or Higher (% of Over 25) by Zip Code (ZCTA5) — Chicago Metro
- % of Population without Health Insurance, by Zip Code (ZCTA5) — Chicago Metro
- Housing Median Monthly Rent ($), by Zip Code (ZCTA5) — Chicago Metro
- Household Average Size by Zip Code (ZCTA5) — Denver Metro
- Housing Owner-Occupied Median Value ($), by Zip Code (ZCTA5) — Denver Metro
- Married Couple (% of all Households) by Zip Code (ZCTA5) — Denver Metro
- High School Graduate (% of Over 25) by Zip Code (ZCTA5) — Denver Metro
- Population Non-Hispanic American Indian % by Zip Code (ZCTA5) — Denver Metro
- Bachelor's Degree or Higher (% of Over 25) by Zip Code (ZCTA5) — Denver Metro
- Population Hispanic % by Zip Code (ZCTA5) — Denver Metro
- % of Population without Health Insurance, by Zip Code (ZCTA5) — Denver Metro
- Housing % of Units Built Since 2010, by Zip Code (ZCTA5) — Denver Metro
- Population Non-Hispanic White % by Zip Code (ZCTA5) — Denver Metro
- Housing Owner-Occupied % of Units, by Zip Code (ZCTA5) — San Antonio Metro
- Housing Owner-Occupied % of Units, by Zip Code (ZCTA5) — Denver Metro
- Housing Owner-Occupied % of Units, by Zip Code (ZCTA5) — Detroit Metro
- Housing Owner-Occupied % of Units, by Zip Code (ZCTA5) — Houston Metro
- Housing Owner-Occupied % of Units, by Zip Code (ZCTA5) — Dallas Metro
- Housing Owner-Occupied % of Units, by Zip Code (ZCTA5) — Chicago Metro
- Housing Owner-Occupied % of Units, by Zip Code (ZCTA5) — San Francisco Metro
- Housing Owner-Occupied % of Units, by Zip Code (ZCTA5) — Miami Metro
- Housing Owner-Occupied % of Units, by Zip Code (ZCTA5) — Seattle Metro
- Housing Owner-Occupied % of Units, by Zip Code (ZCTA5) — Boston Metro