NOTE: Gray indicates insufficient data or a suppressed estimate.
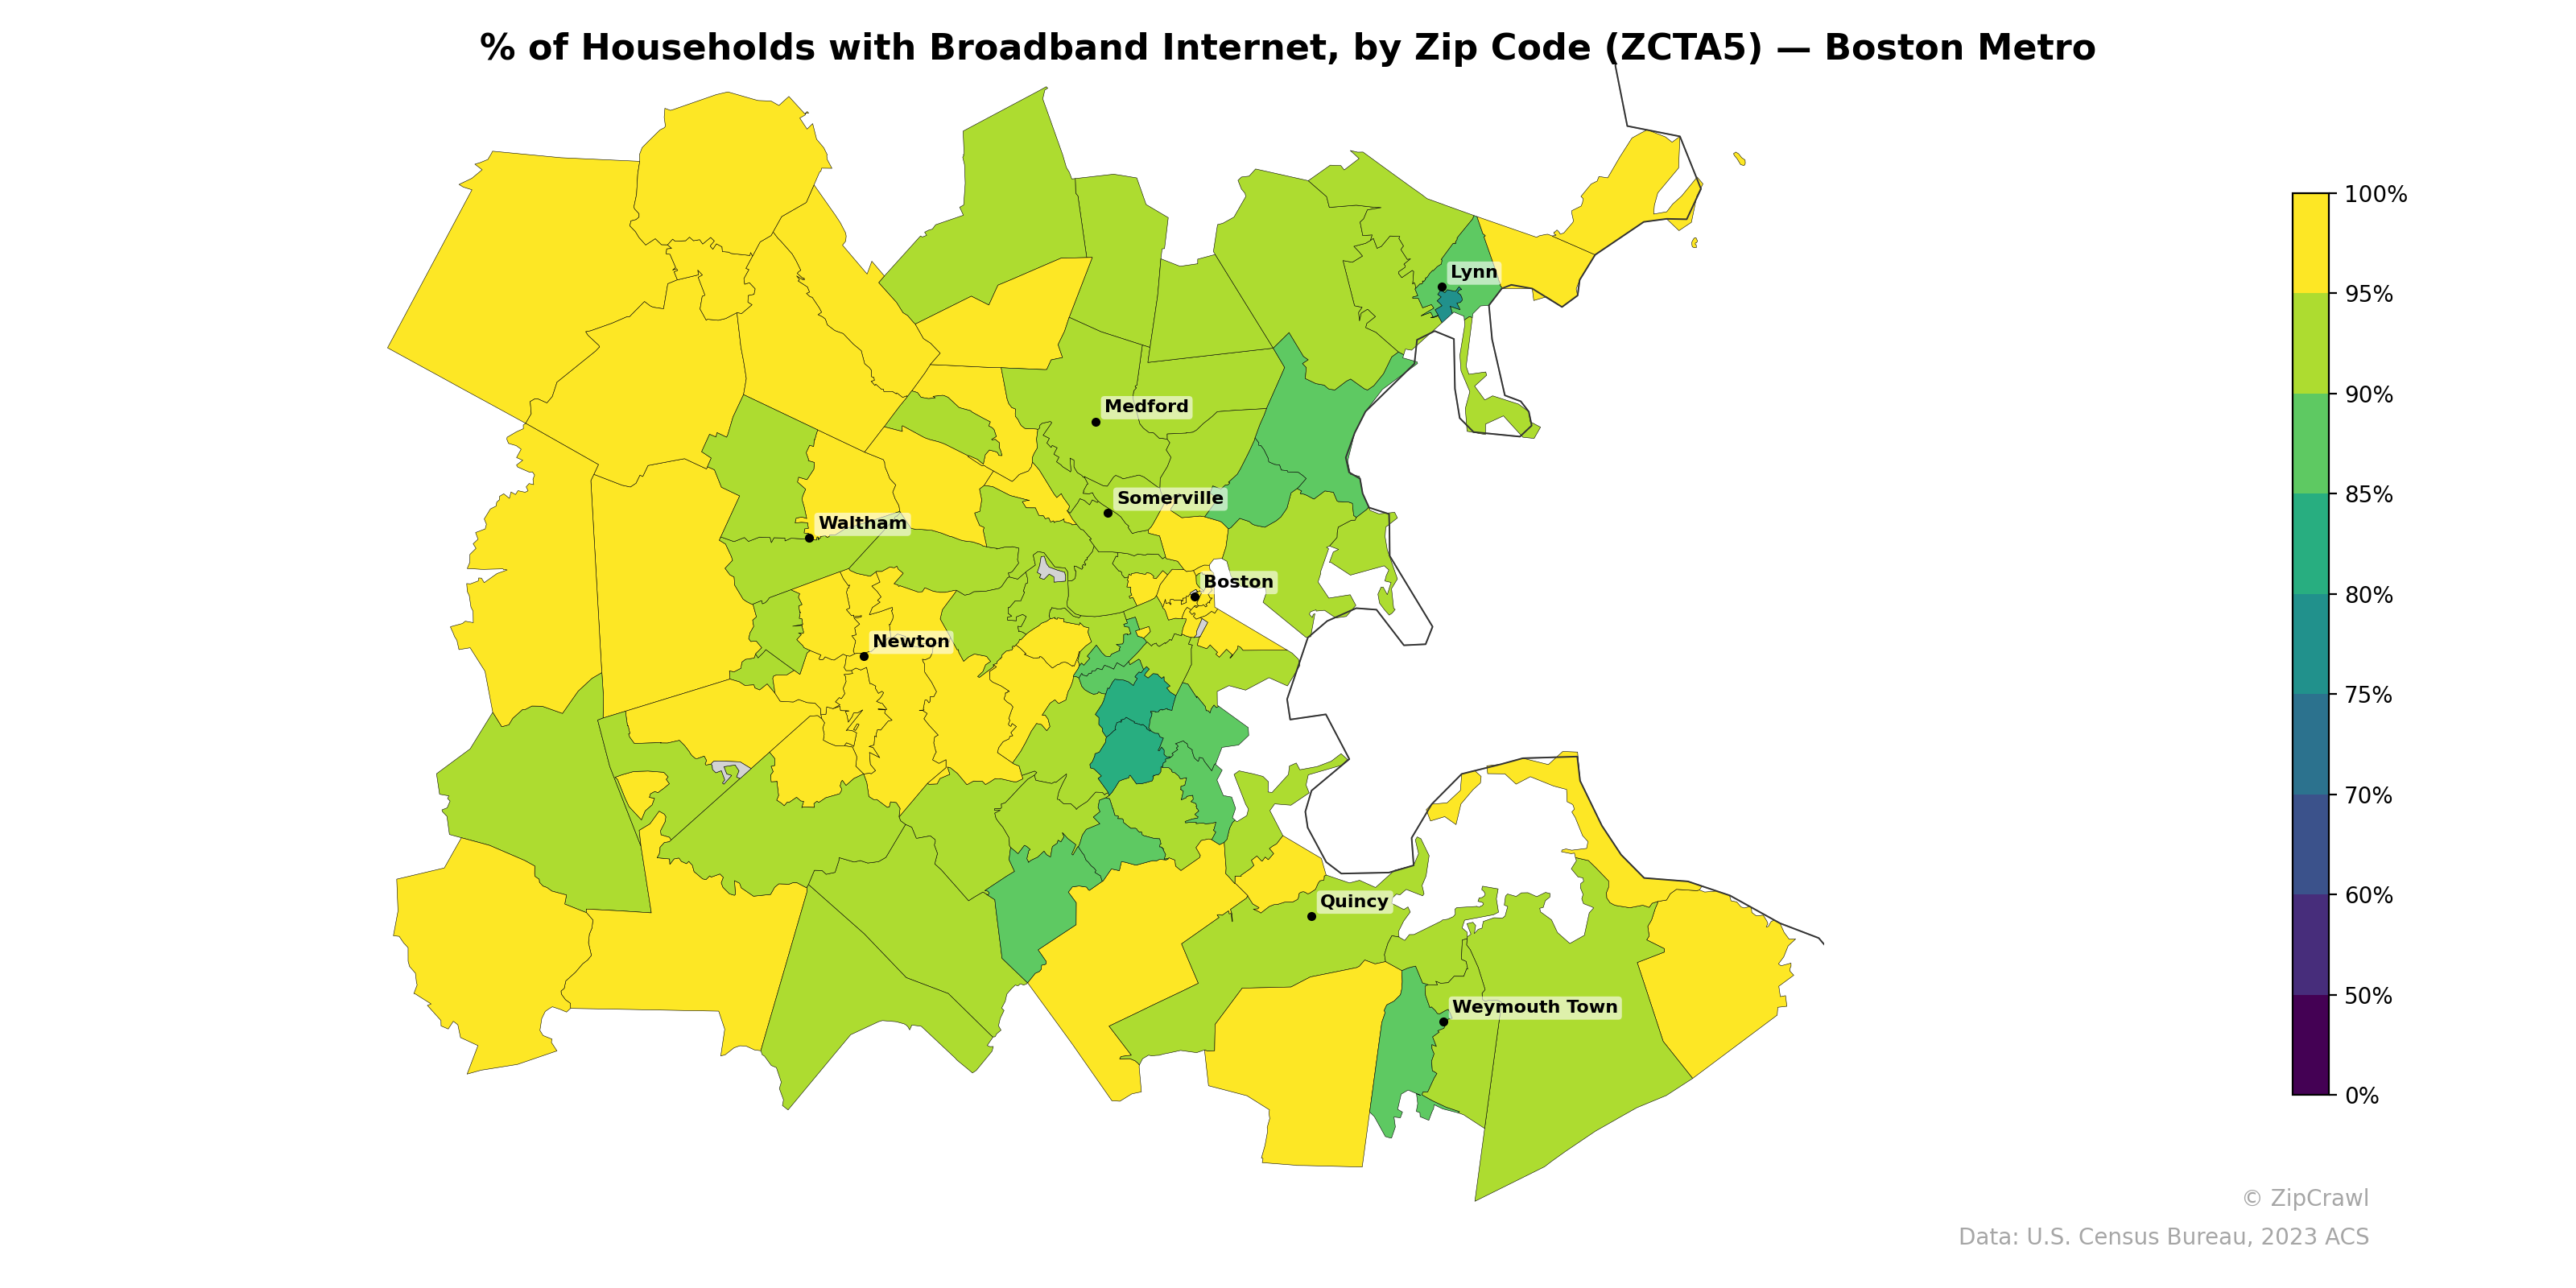
Broadband adoption rates across the Boston metro area generally exceed 80%, with the highest concentrations (95–100%) clustering in suburban zip codes to the west and northwest, including areas around Waltham, Newton, and the outer ring communities. A notable pocket of lower broadband penetration (roughly 60–75%) is visible in parts of Boston proper, particularly in neighborhoods south of downtown and extending toward Quincy, suggesting a digital divide that aligns with historically lower-income urban corridors. The coastal zip codes east of Lynn and areas near Weymouth Town display moderate variability, while Somerville and Medford sit in an intermediate range between their better-connected western suburbs and the lower-adoption urban core.
Data: U.S. Census Bureau, 2023 ACS
Explore
- % of Population on Food Stamps or SNAP (Last 12 Months), by Zip Code (ZCTA5) — Los Angeles Metro
- Housing Vacancy Rate by Zip Code (ZCTA5) — Boston Metro
- Married Couple (% of all Households) by Zip Code (ZCTA5) — Boston Metro
- % of Population without Health Insurance, by Zip Code (ZCTA5) — Boston Metro
- Housing Owner-Occupied Median Value ($), by Zip Code (ZCTA5) — Boston Metro
- Housing Median Monthly Rent ($), by Zip Code (ZCTA5) — Boston Metro
- Housing Owner-Occupied % of Units, by Zip Code (ZCTA5) — Boston Metro
- Bachelor's Degree or Higher (% of Over 25) by Zip Code (ZCTA5) — Boston Metro
- Household Average Size by Zip Code (ZCTA5) — Boston Metro
- Housing % of Units Built Since 2010, by Zip Code (ZCTA5) — Boston Metro
- Housing Vacancy Rate by Zip Code (ZCTA5) — Vermont
- % of Population without Health Insurance, by County
- Household Median Income by Zip Code (ZCTA5) — Chicago Metro
- Population Non-Hispanic Asian % by Zip Code (ZCTA5) — Los Angeles Metro
- Median Age by Zip Code (ZCTA5) — Chicago Metro
- Population Non-Hispanic Black % by Zip Code (ZCTA5) — Chicago Metro
- Population Hispanic % by Zip Code (ZCTA5) — Chicago Metro
- Population Non-Hispanic American Indian % by Zip Code (ZCTA5) — Chicago Metro
- Population Non-Hispanic White % by Zip Code (ZCTA5) — Chicago Metro
- Housing Owner-Occupied % of Units, by County
- High School Graduate (% of Over 25) by Zip Code (ZCTA5) — Chicago Metro
- U.S. Citizens (% of Population Over 18) by Zip Code (ZCTA5) — Chicago Metro
- Population Hispanic % by Zip Code (ZCTA5) — Boston Metro
- Population Non-Hispanic American Indian % by Zip Code (ZCTA5) — Boston Metro
- Household Median Income by Zip Code (ZCTA5) — Boston Metro
- U.S. Citizens (% of Population Over 18) by Zip Code (ZCTA5) — Boston Metro
- Median Age by Zip Code (ZCTA5) — Boston Metro
- Population Non-Hispanic Black % by Zip Code (ZCTA5) — Boston Metro
- High School Graduate (% of Over 25) by Zip Code (ZCTA5) — Detroit Metro
- Housing Owner-Occupied % of Units, by Zip Code (ZCTA5) — Seattle Metro
- % of Households with Broadband Internet, by Zip Code (ZCTA5) — Houston Metro
- % of Households with Broadband Internet, by Zip Code (ZCTA5) — Miami Metro
- % of Households with Broadband Internet, by Zip Code (ZCTA5) — Orlando Metro
- % of Households with Broadband Internet, by Zip Code (ZCTA5) — Tampa Metro
- % of Households with Broadband Internet, by Zip Code (ZCTA5) — Detroit Metro
- % of Households with Broadband Internet, by Zip Code (ZCTA5) — Chicago Metro
- % of Households with Broadband Internet, by Zip Code (ZCTA5) — Denver Metro
- % of Households with Broadband Internet, by Zip Code (ZCTA5) — Dallas Metro
- % of Households with Broadband Internet, by Zip Code (ZCTA5) — Austin Metro
- % of Households with Broadband Internet, by Zip Code (ZCTA5) — Portland Metro