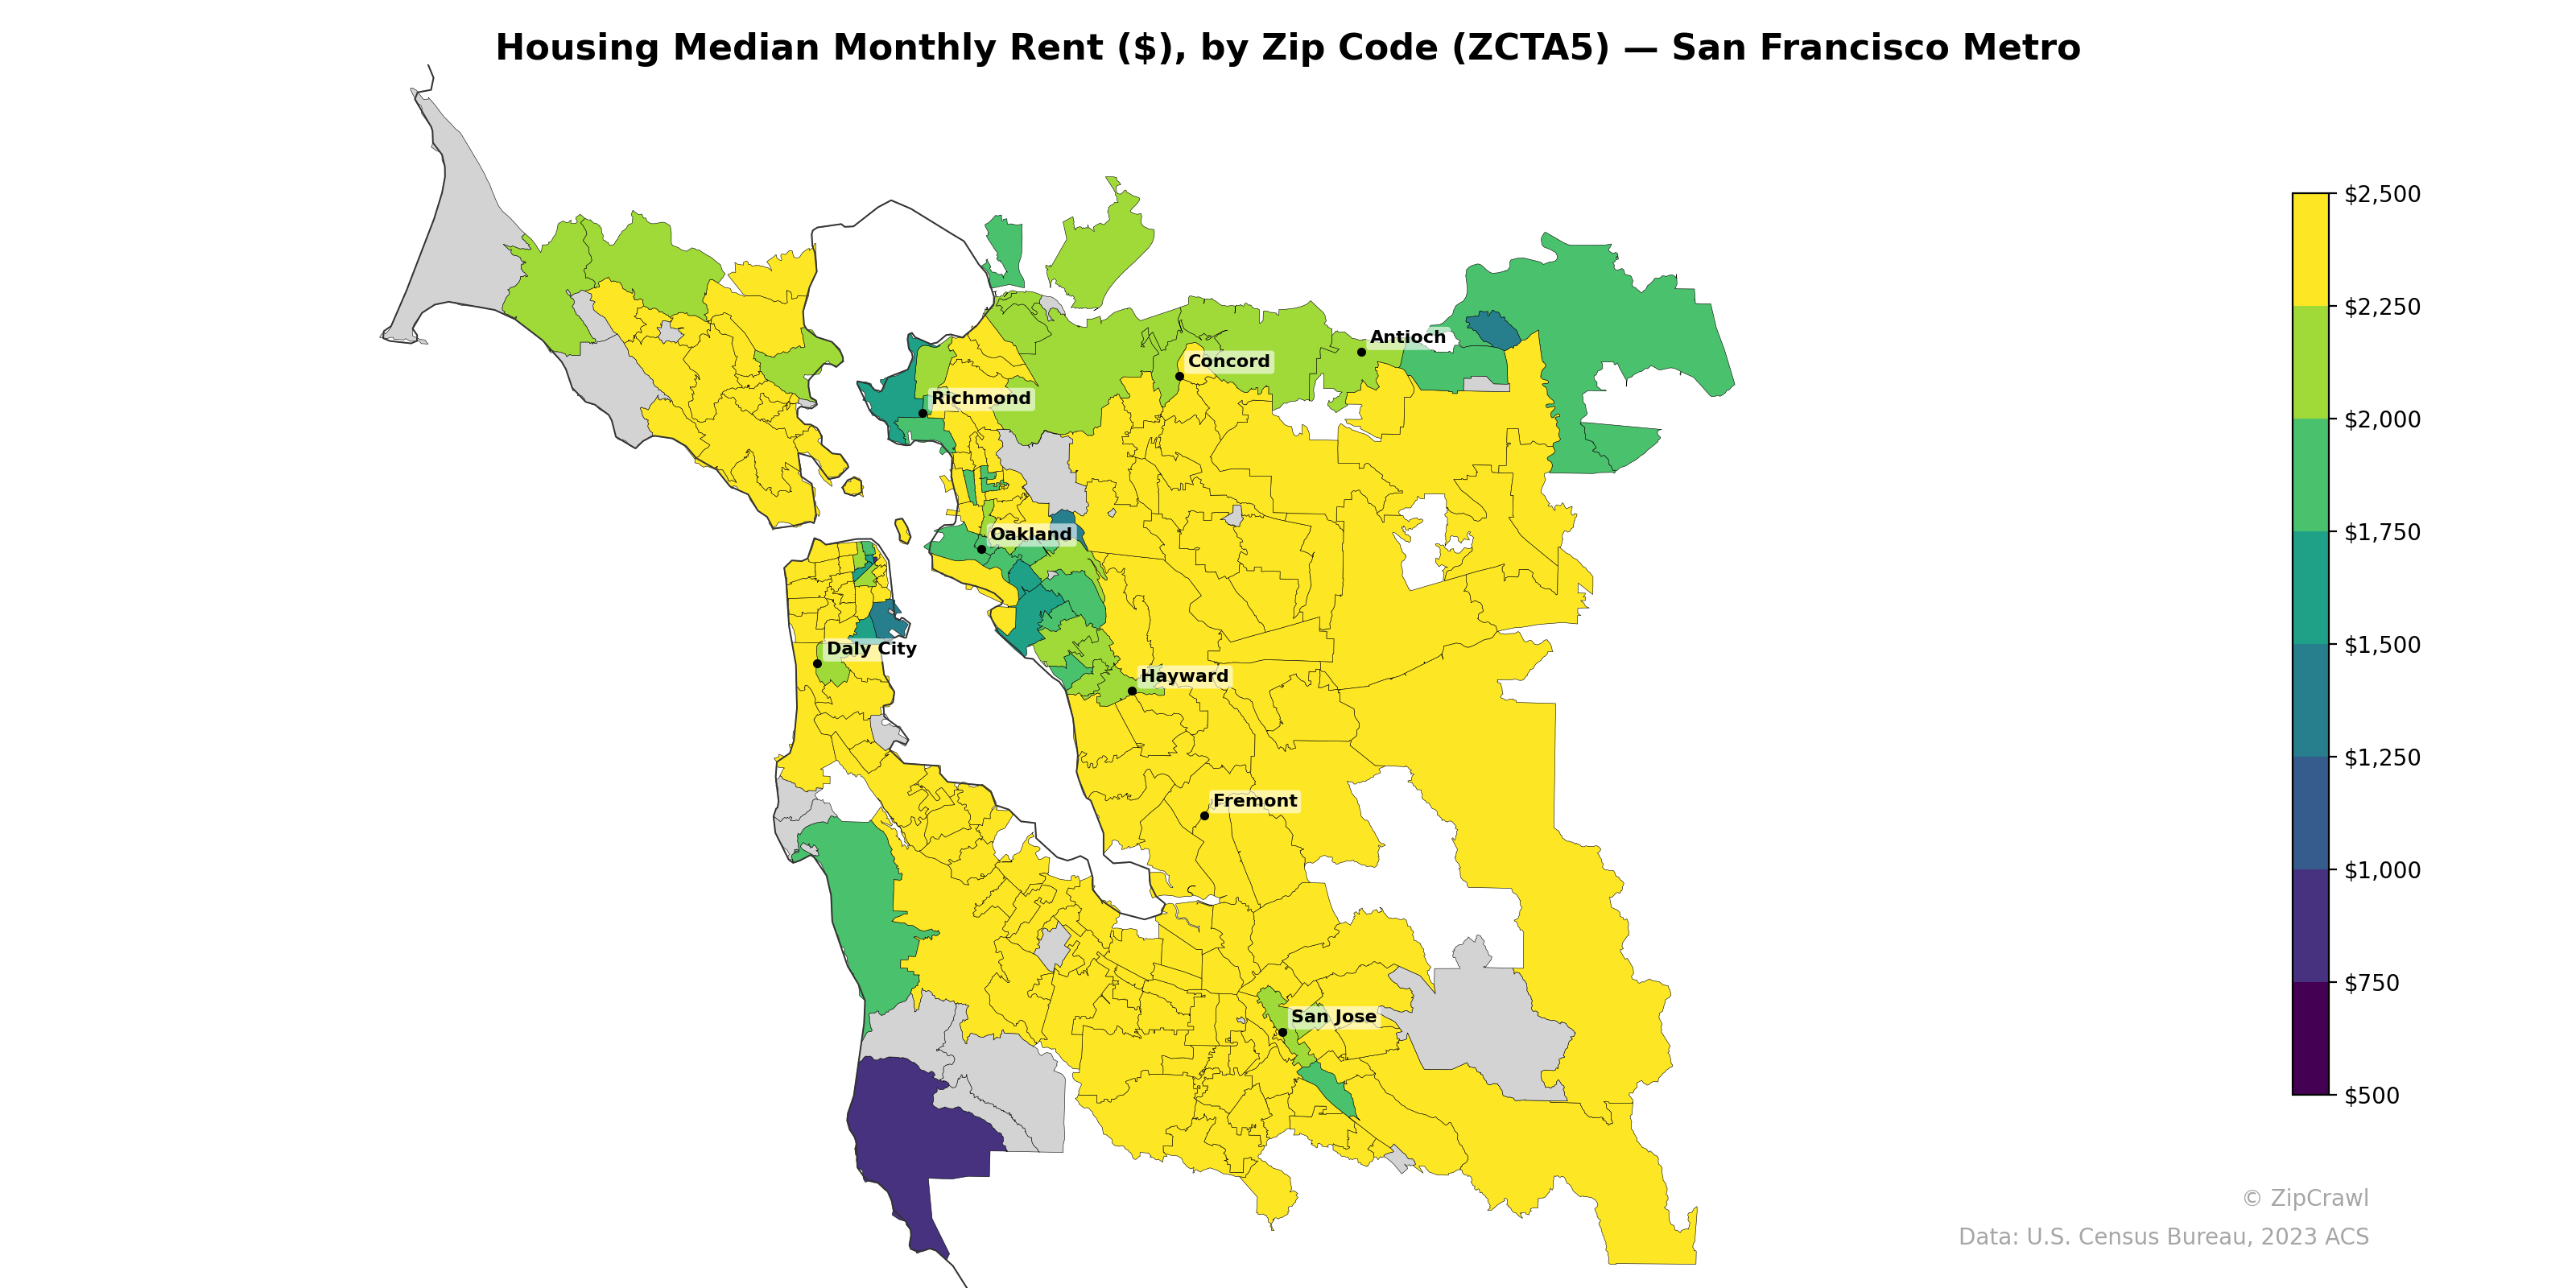
NOTE: Gray indicates insufficient data or a suppressed estimate.
Median monthly rents across the San Francisco metro area predominantly fall in the $2,000–$2,500 range, with the highest concentrations of yellow (top-tier rents) spanning the South Bay through San Jose, Fremont, and much of the Peninsula south of Daly City. A distinct lower-rent corridor emerges along the urban core of Oakland and surrounding East Bay neighborhoods, as well as pockets near Richmond and parts of San Francisco proper, where rents drop into the $1,250–$1,750 range. The far southern edge of the metro area near Gilroy stands out with notably depressed rents below $750, representing the sharpest contrast to the otherwise high-cost region.
Data: U.S. Census Bureau, 2023 ACS
Explore
- Household Median Income by Zip Code (ZCTA5) — Chicago Metro
- Housing % of Units Built Since 2010, by Zip Code (ZCTA5) — San Francisco Metro
- % of Households with Broadband Internet, by Zip Code (ZCTA5) — San Francisco Metro
- Household Average Size by Zip Code (ZCTA5) — San Francisco Metro
- Housing Owner-Occupied % of Units, by Zip Code (ZCTA5) — San Francisco Metro
- Housing Owner-Occupied Median Value ($), by Zip Code (ZCTA5) — San Francisco Metro
- Married Couple (% of all Households) by Zip Code (ZCTA5) — San Francisco Metro
- Bachelor's Degree or Higher (% of Over 25) by Zip Code (ZCTA5) — San Francisco Metro
- % of Population without Health Insurance, by Zip Code (ZCTA5) — San Francisco Metro
- Housing Vacancy Rate by Zip Code (ZCTA5) — San Francisco Metro
- Household Median Income by Zip Code (ZCTA5) — Washington D.C.
- % of Population without Health Insurance, by County
- % of Population on Food Stamps or SNAP (Last 12 Months), by Zip Code (ZCTA5) — Los Angeles Metro
- Population Non-Hispanic Asian % by Zip Code (ZCTA5) — Los Angeles Metro
- Median Age by Zip Code (ZCTA5) — Chicago Metro
- Population Hispanic % by Zip Code (ZCTA5) — Chicago Metro
- Population Non-Hispanic Black % by Zip Code (ZCTA5) — Chicago Metro
- Housing % of Units Built Since 2010, by Zip Code (ZCTA5) — New York Metro
- Population Non-Hispanic American Indian % by Zip Code (ZCTA5) — Chicago Metro
- High School Graduate (% of Over 25) by Zip Code (ZCTA5) — Chicago Metro
- Population Non-Hispanic White % by Zip Code (ZCTA5) — Chicago Metro
- U.S. Citizens (% of Population Over 18) by Zip Code (ZCTA5) — Chicago Metro
- % of Population without Health Insurance, by Zip Code (ZCTA5) — Boston Metro
- Bachelor's Degree or Higher (% of Over 25) by Zip Code (ZCTA5) — Boston Metro
- Housing Owner-Occupied % of Units, by Zip Code (ZCTA5) — Boston Metro
- Median Age by Zip Code (ZCTA5) — Boston Metro
- Population Non-Hispanic Black % by Zip Code (ZCTA5) — Boston Metro
- Population Non-Hispanic American Indian % by Zip Code (ZCTA5) — Boston Metro
- % of Households with Broadband Internet, by Zip Code (ZCTA5) — Boston Metro
- Household Median Income by Zip Code (ZCTA5) — Boston Metro
- Housing Median Monthly Rent ($), by Zip Code (ZCTA5) — San Diego Metro
- Housing Median Monthly Rent ($), by Zip Code (ZCTA5) — San Antonio Metro
- Housing Median Monthly Rent ($), by Zip Code (ZCTA5) — Houston Metro
- Housing Median Monthly Rent ($), by Zip Code (ZCTA5) — Miami Metro
- Housing Median Monthly Rent ($), by Zip Code (ZCTA5) — Seattle Metro
- Housing Median Monthly Rent ($), by Zip Code (ZCTA5) — Boston Metro
- Housing Median Monthly Rent ($), by Zip Code (ZCTA5) — Detroit Metro
- Housing Median Monthly Rent ($), by Zip Code (ZCTA5) — Tampa Metro
- Housing Median Monthly Rent ($), by Zip Code (ZCTA5) — St. Louis Metro
- Housing Median Monthly Rent ($), by Zip Code (ZCTA5) — Chicago Metro