NOTE: Gray indicates insufficient data or a suppressed estimate.
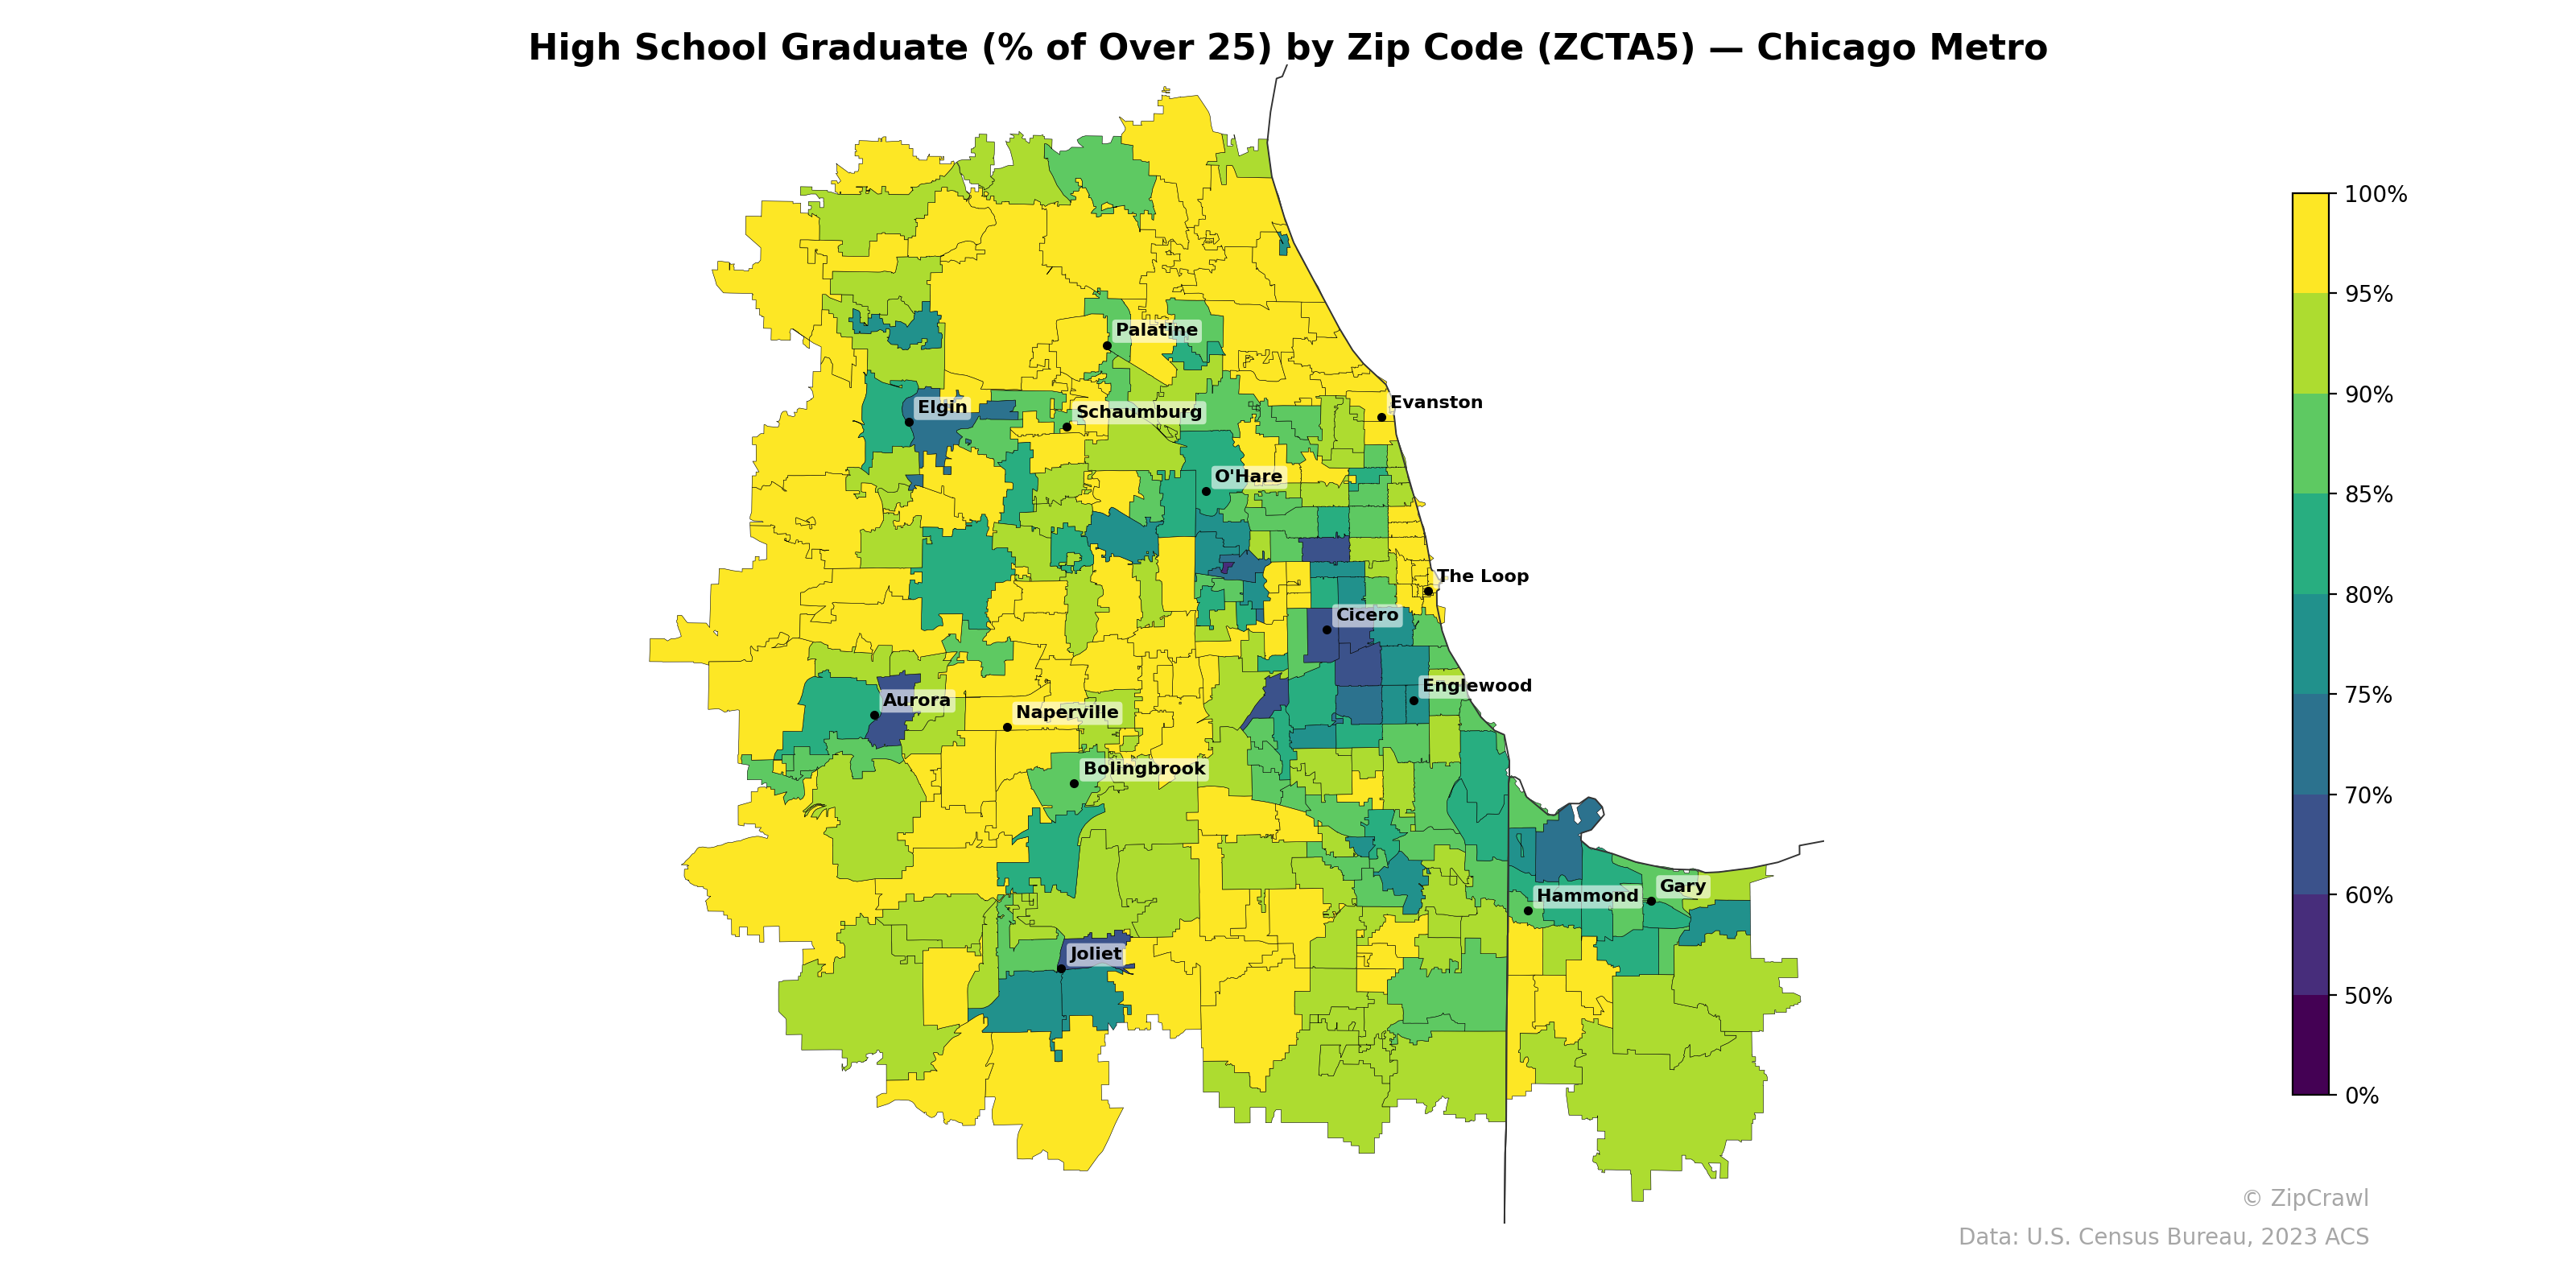
High school graduation rates across the Chicago metro area exhibit a stark urban-suburban divide, with outer suburban communities in DuPage, western Cook, and McHenry counties consistently exceeding 95%, while concentrated pockets of lower attainment (below 70%) cluster in Chicago's South and West Side neighborhoods—particularly around Englewood, Cicero, and Back of the Yards—as well as in Gary, Indiana. Northwestern suburbs such as Naperville, Schaumburg, and Palatine form a broad band of high attainment (90–100%), contrasting sharply with the deep teal and blue zip codes along the city's industrial corridors and south lakefront. A secondary cluster of lower graduation rates is visible around Elgin and parts of Aurora, likely reflecting immigrant-dense communities where educational attainment patterns differ from surrounding suburban areas.
Data: U.S. Census Bureau, 2023 ACS
Explore
- Housing % of Units Built Since 2010, by Zip Code (ZCTA5) — Minneapolis Metro
- Married Couple (% of all Households) by Zip Code (ZCTA5) — Minneapolis Metro
- Housing Owner-Occupied Median Value ($), by Zip Code (ZCTA5) — Minneapolis Metro
- Bachelor's Degree or Higher (% of Over 25) by Zip Code (ZCTA5) — Minneapolis Metro
- Household Average Size by Zip Code (ZCTA5) — Minneapolis Metro
- Housing Median Monthly Rent ($), by Zip Code (ZCTA5) — Minneapolis Metro
- % of Households with Broadband Internet, by Zip Code (ZCTA5) — Minneapolis Metro
- % of Population without Health Insurance, by Zip Code (ZCTA5) — Minneapolis Metro
- Housing Owner-Occupied % of Units, by Zip Code (ZCTA5) — Minneapolis Metro
- Housing Vacancy Rate by Zip Code (ZCTA5) — Minneapolis Metro
- % of Population without Health Insurance, by County
- Median Age by Zip Code (ZCTA5) — Chicago Metro
- Household Median Income by Zip Code (ZCTA5) — Chicago Metro
- Population Non-Hispanic White % by Zip Code (ZCTA5) — Chicago Metro
- % of Population on Food Stamps or SNAP (Last 12 Months), by Zip Code (ZCTA5) — Los Angeles Metro
- U.S. Citizens (% of Population Over 18) by Zip Code (ZCTA5) — Chicago Metro
- Population Non-Hispanic Black % by Zip Code (ZCTA5) — Chicago Metro
- Population Hispanic % by Zip Code (ZCTA5) — Chicago Metro
- Population Non-Hispanic American Indian % by Zip Code (ZCTA5) — Chicago Metro
- Population Non-Hispanic Asian % by Zip Code (ZCTA5) — Los Angeles Metro
- Housing Median Monthly Rent ($), by Zip Code (ZCTA5) — Boston Metro
- Housing Owner-Occupied % of Units, by Zip Code (ZCTA5) — Boston Metro
- Housing % of Units Built Since 2010, by Zip Code (ZCTA5) — Boston Metro
- Population Non-Hispanic Black % by Zip Code (ZCTA5) — Boston Metro
- Population Hispanic % by Zip Code (ZCTA5) — Boston Metro
- Population Non-Hispanic American Indian % by Zip Code (ZCTA5) — Boston Metro
- % of Households with Broadband Internet, by Zip Code (ZCTA5) — Boston Metro
- % of Population without Health Insurance, by Zip Code (ZCTA5) — Boston Metro
- Housing Owner-Occupied Median Value ($), by Zip Code (ZCTA5) — Boston Metro
- Median Age by Zip Code (ZCTA5) — Boston Metro
- High School Graduate (% of Over 25) by Zip Code (ZCTA5) — Denver Metro
- High School Graduate (% of Over 25) by Zip Code (ZCTA5) — Miami Metro
- High School Graduate (% of Over 25) by Zip Code (ZCTA5) — Charlotte Metro
- High School Graduate (% of Over 25) by Zip Code (ZCTA5) — Boston Metro
- High School Graduate (% of Over 25) by Zip Code (ZCTA5) — Detroit Metro
- High School Graduate (% of Over 25) by Zip Code (ZCTA5) — Tampa Metro
- High School Graduate (% of Over 25) by Zip Code (ZCTA5) — San Diego Metro
- High School Graduate (% of Over 25) by Zip Code (ZCTA5) — Houston Metro
- High School Graduate (% of Over 25) by Zip Code (ZCTA5) — Orlando Metro
- High School Graduate (% of Over 25) by Zip Code (ZCTA5) — Dallas Metro