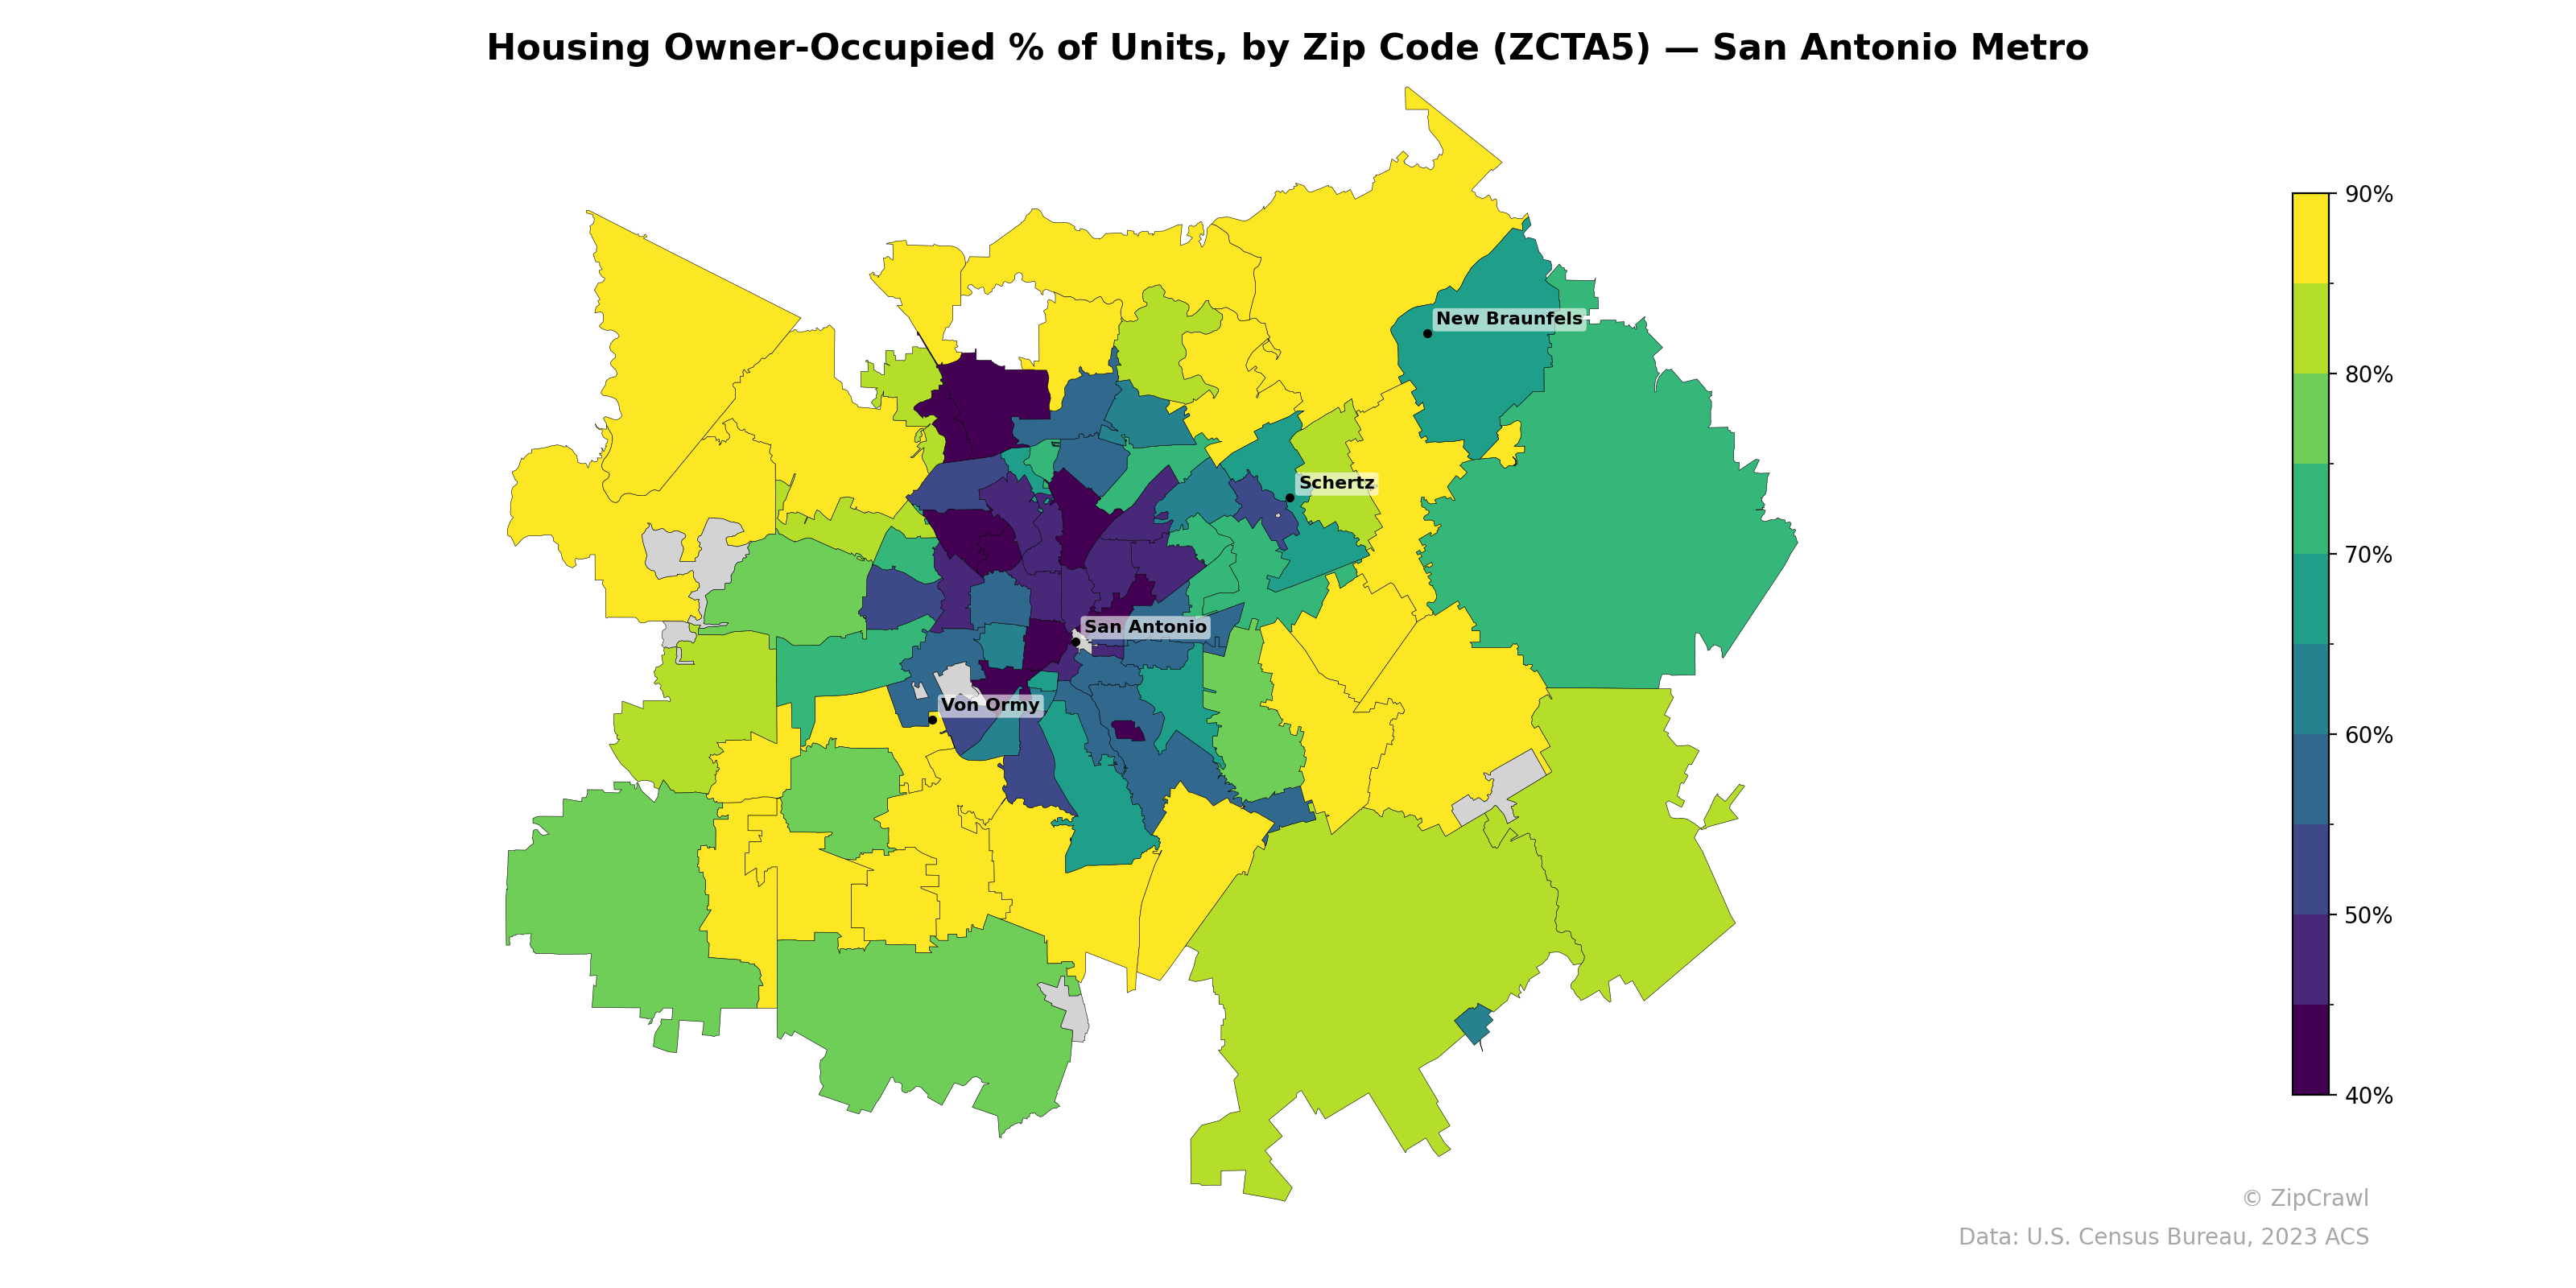
NOTE: Gray indicates insufficient data or a suppressed estimate.
Owner-occupancy rates in the San Antonio metro follow a clear core-periphery pattern, with the lowest concentrations (below 50%) clustered in the central and near-south zip codes around downtown San Antonio, likely reflecting higher densities of rental apartments and military-adjacent housing. Suburban and exurban zip codes to the north, northwest, and south exhibit markedly higher homeownership rates, frequently exceeding 80–90%, with particularly strong concentrations in the far north toward New Braunfels and the outer western and southwestern fringes. A notable exception is a pocket of lower owner-occupancy in the far southeast, contrasting with the otherwise high rates typical of the metro's peripheral areas.
Data: U.S. Census Bureau, 2023 ACS
Explore
- Population Non-Hispanic White % by Zip Code (ZCTA5) — Texas
- % of Households with Broadband Internet, by Zip Code (ZCTA5) — San Antonio Metro
- Bachelor's Degree or Higher (% of Over 25) by Zip Code (ZCTA5) — San Antonio Metro
- Household Average Size by Zip Code (ZCTA5) — San Antonio Metro
- Married Couple (% of all Households) by Zip Code (ZCTA5) — San Antonio Metro
- % of Population without Health Insurance, by Zip Code (ZCTA5) — San Antonio Metro
- Housing Vacancy Rate by Zip Code (ZCTA5) — San Antonio Metro
- Housing Owner-Occupied Median Value ($), by Zip Code (ZCTA5) — San Antonio Metro
- Housing Median Monthly Rent ($), by Zip Code (ZCTA5) — San Antonio Metro
- Housing % of Units Built Since 2010, by Zip Code (ZCTA5) — San Antonio Metro
- High School Graduate (% of Over 25) by County
- U.S. Citizens (% of Population Over 18) by Zip Code (ZCTA5) — Texas
- Household Median Income by Zip Code (ZCTA5) — Texas
- Population Non-Hispanic Asian % by Zip Code (ZCTA5) — Chicago Metro
- Population Hispanic % by Zip Code (ZCTA5) — Texas
- Population Non-Hispanic American Indian % by Zip Code (ZCTA5) — Texas
- Median Age by Zip Code (ZCTA5) — Texas
- Population Non-Hispanic Black % by Zip Code (ZCTA5) — Texas
- High School Graduate (% of Over 25) by Zip Code (ZCTA5) — Texas
- % of Population on Food Stamps or SNAP (Last 12 Months), by Zip Code (ZCTA5) — Chicago Metro
- % of Households with Broadband Internet, by Zip Code (ZCTA5) — Baltimore Metro
- Bachelor's Degree or Higher (% of Over 25) by Zip Code (ZCTA5) — Baltimore Metro
- % of Population without Health Insurance, by Zip Code (ZCTA5) — Baltimore Metro
- Population Non-Hispanic Asian % by Zip Code (ZCTA5) — Charlotte Metro
- Population Non-Hispanic Asian % by Zip Code (ZCTA5) — Baltimore Metro
- % of Population on Food Stamps or SNAP (Last 12 Months), by Zip Code (ZCTA5) — Charlotte Metro
- Household Median Income by Zip Code (ZCTA5) — Baltimore Metro
- High School Graduate (% of Over 25) by Zip Code (ZCTA5) — Baltimore Metro
- Population Non-Hispanic Black % by Zip Code (ZCTA5) — Baltimore Metro
- Married Couple (% of all Households) by Zip Code (ZCTA5) — Austin Metro
- Housing Owner-Occupied % of Units, by Zip Code (ZCTA5) — San Diego Metro
- Housing Owner-Occupied % of Units, by Zip Code (ZCTA5) — Houston Metro
- Housing Owner-Occupied % of Units, by Zip Code (ZCTA5) — Atlanta Metro
- Housing Owner-Occupied % of Units, by Zip Code (ZCTA5) — Boston Metro
- Housing Owner-Occupied % of Units, by Zip Code (ZCTA5) — Austin Metro
- Housing Owner-Occupied % of Units, by Zip Code (ZCTA5) — San Francisco Metro
- Housing Owner-Occupied % of Units, by Zip Code (ZCTA5) — Miami Metro
- Housing Owner-Occupied % of Units, by Zip Code (ZCTA5) — Seattle Metro
- Housing Owner-Occupied % of Units, by Zip Code (ZCTA5) — Tampa Metro
- Housing Owner-Occupied % of Units, by Zip Code (ZCTA5) — Detroit Metro