NOTE: Gray indicates insufficient data or a suppressed estimate.
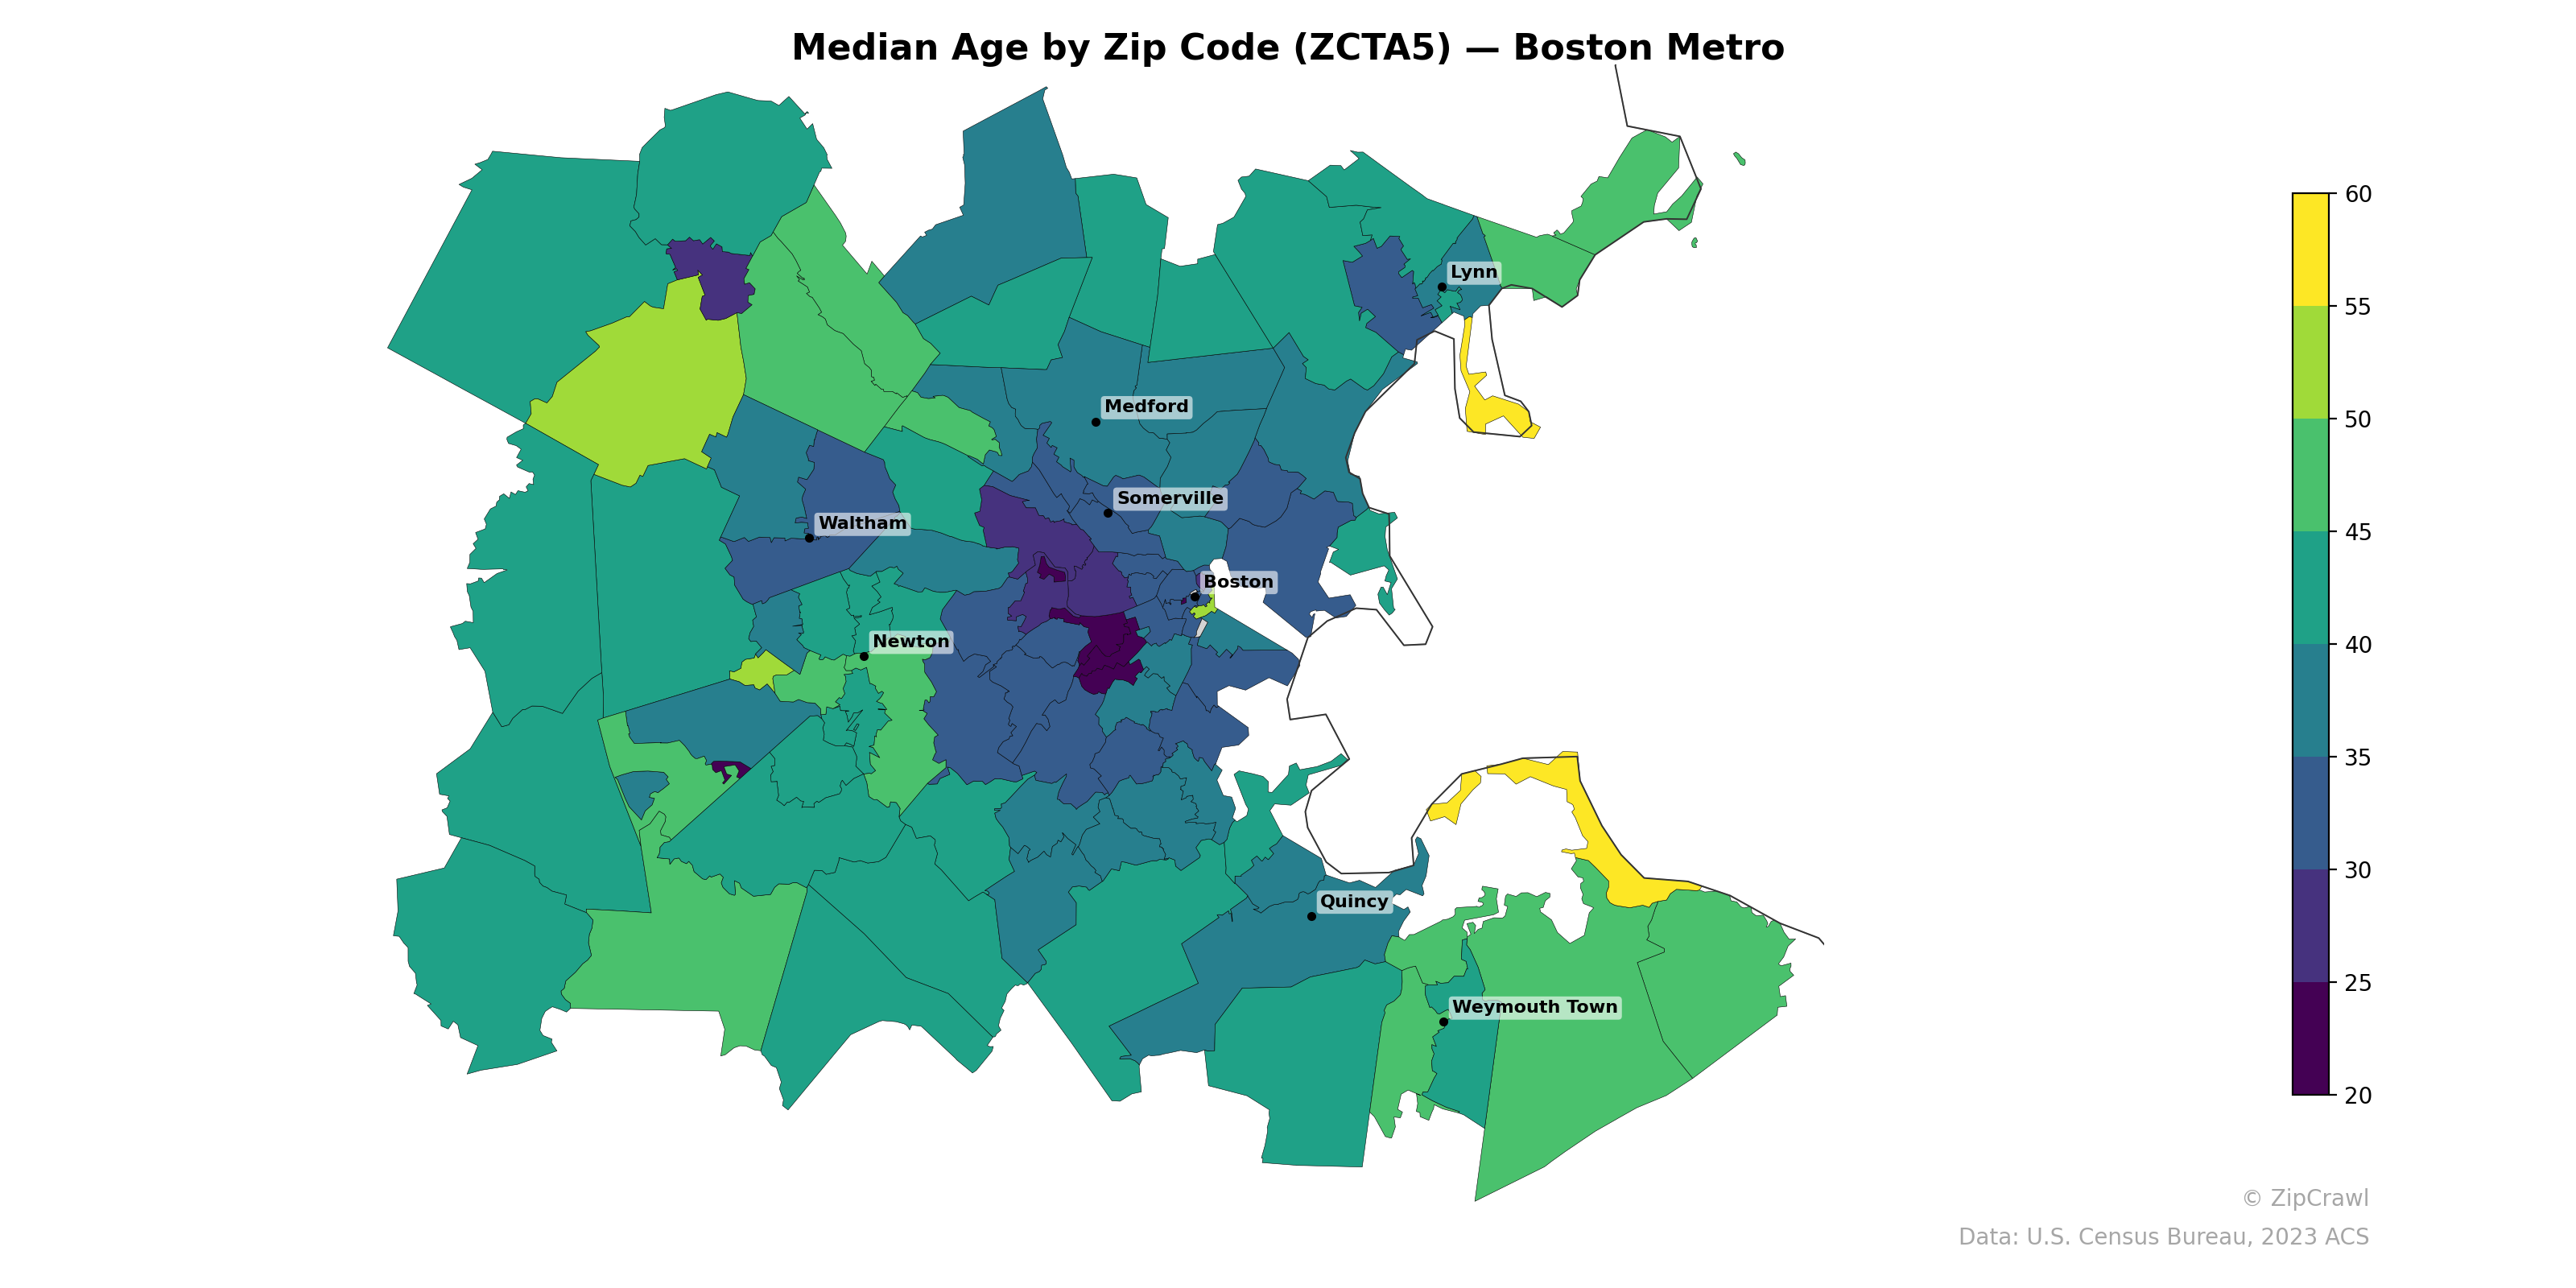
The lowest median ages in the Boston metro cluster tightly around the core Boston zip codes—particularly near the university-dense areas of Allston, Brighton, and the Fenway—where median ages dip below 25, reflecting large student populations. Suburban and exurban zip codes to the northwest and south, including parts of Newton, Waltham, and Weymouth, trend notably older with median ages in the 38–50 range. The most striking outliers are the bright yellow coastal zip codes near Lynn and Hull, where median ages exceed 55, standing in sharp contrast to the younger urban core just miles away.
Data: U.S. Census Bureau, 2023 ACS
Explore
- Population Non-Hispanic Asian % by Zip Code (ZCTA5) — Los Angeles Metro
- U.S. Citizens (% of Population Over 18) by Zip Code (ZCTA5) — Boston Metro
- % of Population on Food Stamps or SNAP (Last 12 Months), by Zip Code (ZCTA5) — Maryland
- Population Non-Hispanic Asian % by Zip Code (ZCTA5) — Maryland
- Population Non-Hispanic White % by Zip Code (ZCTA5) — Boston Metro
- Household Median Income by Zip Code (ZCTA5) — Boston Metro
- Population Non-Hispanic Black % by Zip Code (ZCTA5) — Boston Metro
- High School Graduate (% of Over 25) by Zip Code (ZCTA5) — Boston Metro
- Population Non-Hispanic American Indian % by Zip Code (ZCTA5) — Boston Metro
- Population Hispanic % by Zip Code (ZCTA5) — Boston Metro
- % of Population without Health Insurance, by Zip Code (ZCTA5) — Vermont
- % of Population without Health Insurance, by County
- Household Median Income by Zip Code (ZCTA5) — Chicago Metro
- U.S. Citizens (% of Population Over 18) by Zip Code (ZCTA5) — Chicago Metro
- Population Non-Hispanic White % by Zip Code (ZCTA5) — Chicago Metro
- High School Graduate (% of Over 25) by Zip Code (ZCTA5) — Chicago Metro
- % of Population on Food Stamps or SNAP (Last 12 Months), by Zip Code (ZCTA5) — Los Angeles Metro
- Population Hispanic % by Zip Code (ZCTA5) — Chicago Metro
- Population Non-Hispanic Black % by Zip Code (ZCTA5) — Chicago Metro
- Population Non-Hispanic American Indian % by Zip Code (ZCTA5) — Chicago Metro
- Housing Owner-Occupied Median Value ($), by Zip Code (ZCTA5) — Boston Metro
- % of Population without Health Insurance, by Zip Code (ZCTA5) — Boston Metro
- Housing Median Monthly Rent ($), by Zip Code (ZCTA5) — Boston Metro
- Housing Owner-Occupied % of Units, by Zip Code (ZCTA5) — Seattle Metro
- Housing % of Units Built Since 2010, by Zip Code (ZCTA5) — Boston Metro
- High School Graduate (% of Over 25) by Zip Code (ZCTA5) — Detroit Metro
- Bachelor's Degree or Higher (% of Over 25) by Zip Code (ZCTA5) — Boston Metro
- % of Households with Broadband Internet, by Zip Code (ZCTA5) — Boston Metro
- Housing Owner-Occupied % of Units, by Zip Code (ZCTA5) — Boston Metro
- % of Population without Health Insurance, by Zip Code (ZCTA5) — Seattle Metro
- Median Age by Zip Code (ZCTA5) — Houston Metro
- Median Age by Zip Code (ZCTA5) — Miami Metro
- Median Age by Zip Code (ZCTA5) — Tampa Metro
- Median Age by Zip Code (ZCTA5) — Detroit Metro
- Median Age by Zip Code (ZCTA5) — Austin Metro
- Median Age by Zip Code (ZCTA5) — Atlanta Metro
- Median Age by Zip Code (ZCTA5) — Denver Metro
- Median Age by Zip Code (ZCTA5) — Chicago Metro
- Median Age by Zip Code (ZCTA5) — Dallas Metro
- Median Age by Zip Code (ZCTA5) — San Antonio Metro