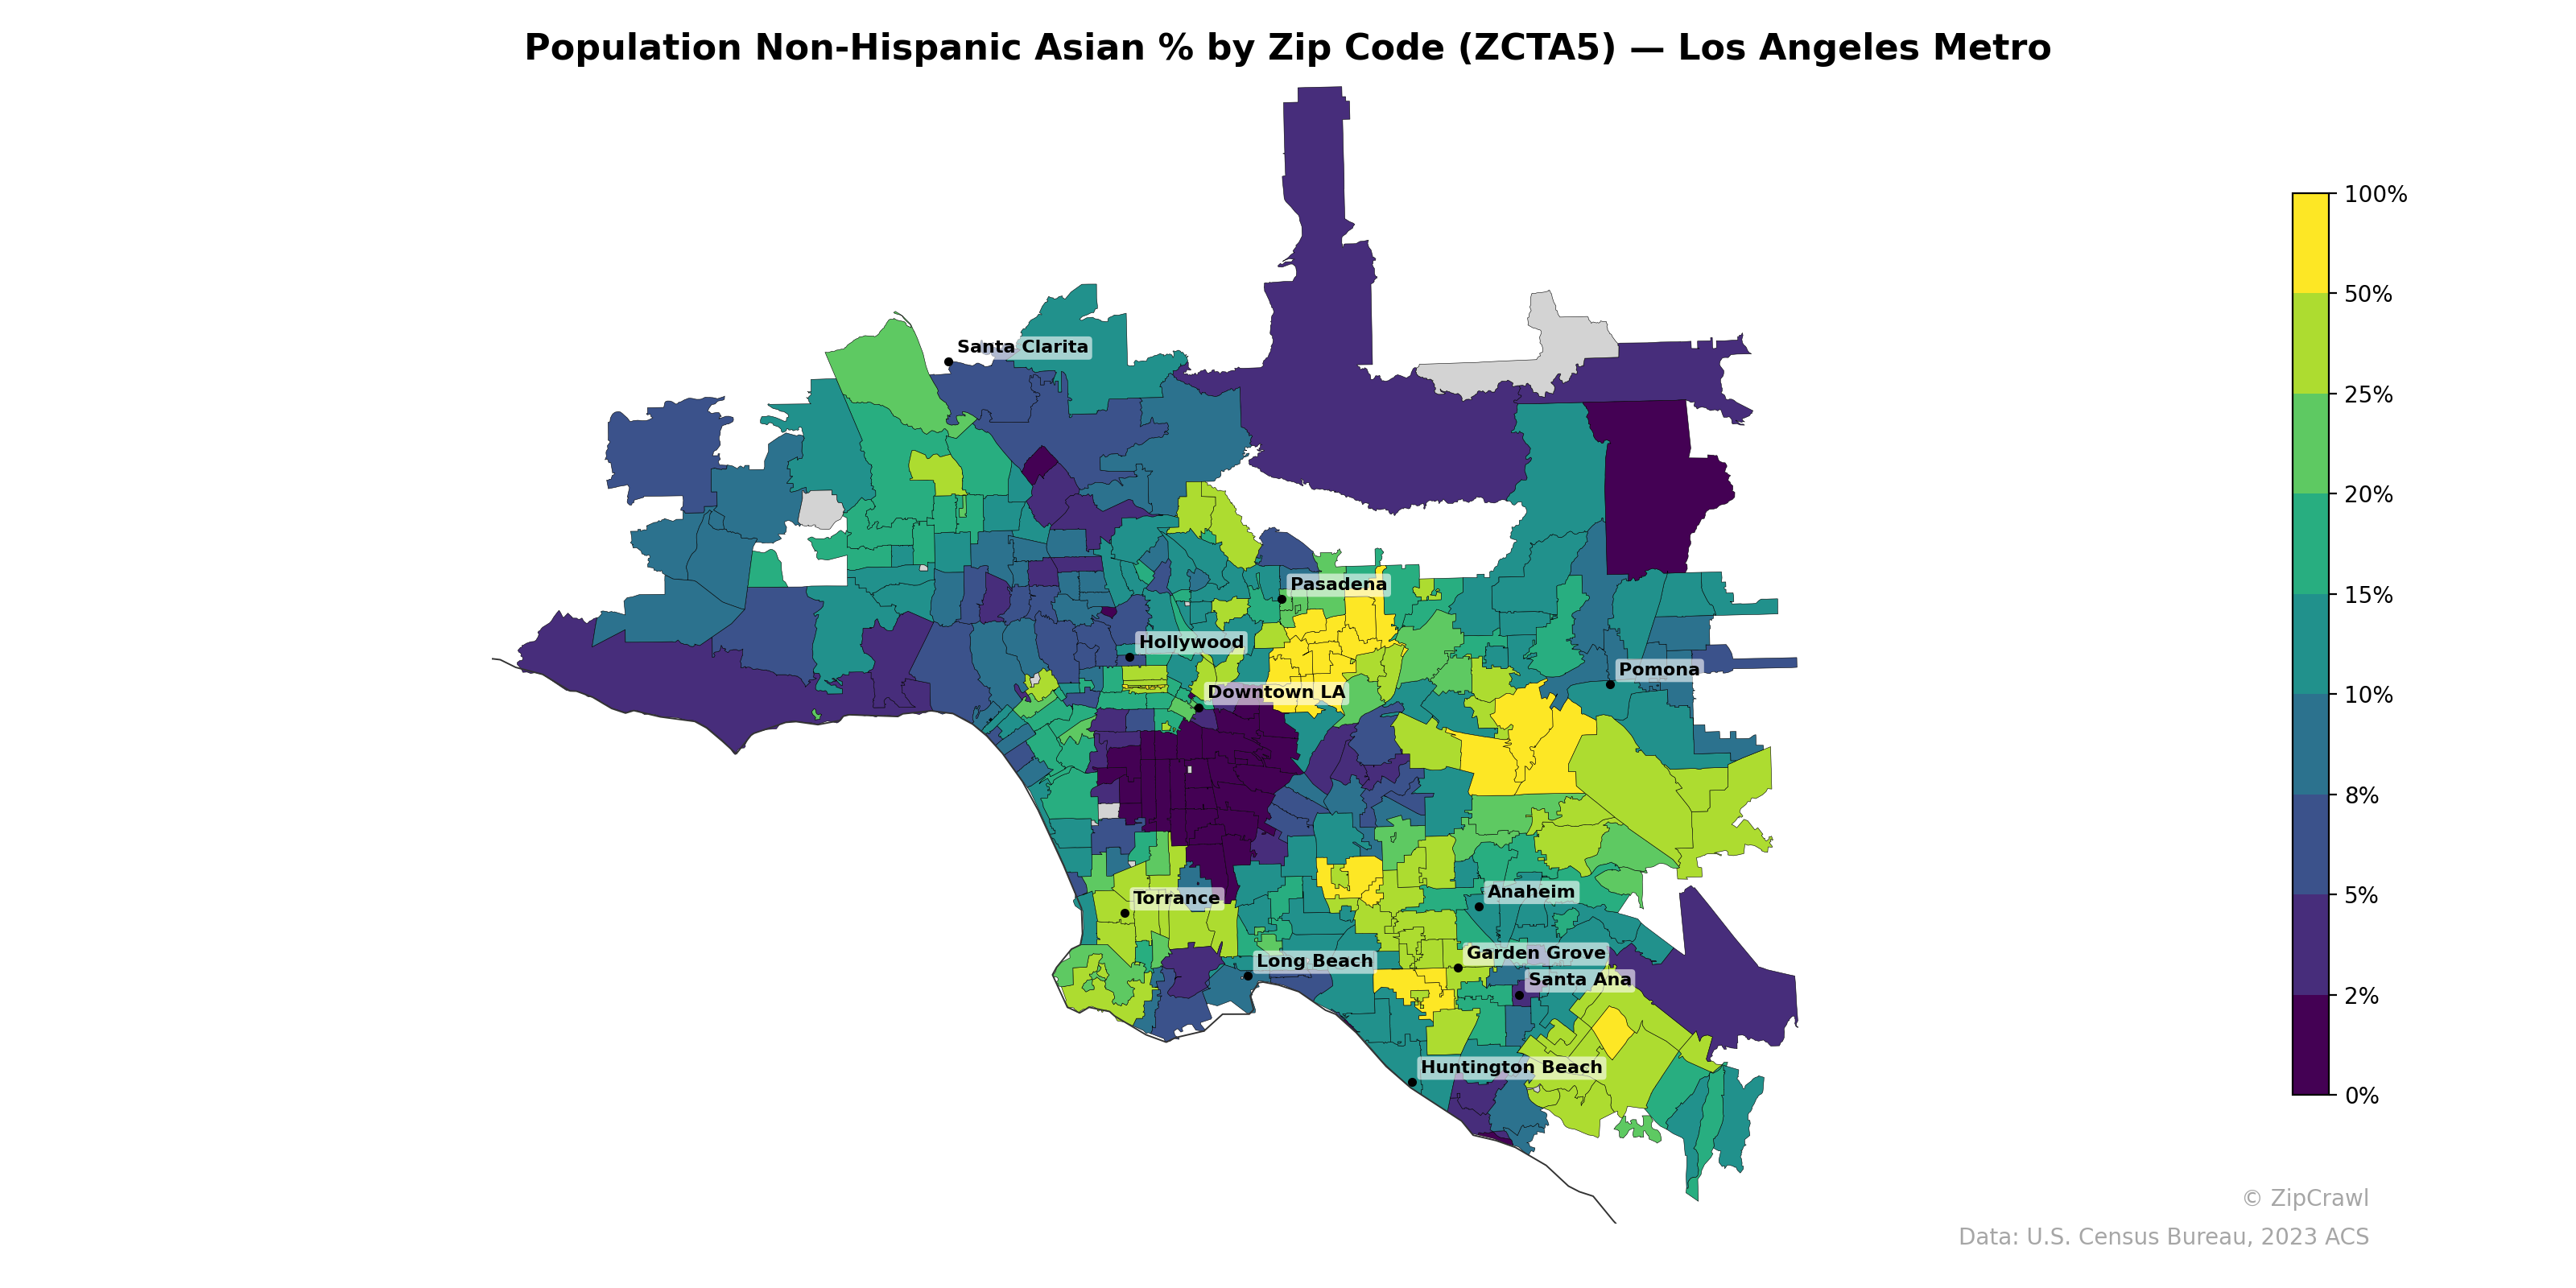
NOTE: Gray indicates insufficient data or a suppressed estimate.
The highest concentrations of Non-Hispanic Asian residents cluster in the San Gabriel Valley east of Downtown LA, where several zip codes exceed 50%, forming a distinct corridor that extends from Monterey Park through Rowland Heights and into the Diamond Bar area. A secondary concentration appears in the Garden Grove–Westminster area of Orange County, likely reflecting the established Vietnamese American community, with surrounding zip codes in Irvine and Cerritos also showing elevated percentages in the 25–50% range. By contrast, South Los Angeles, the Antelope Valley fringes, and much of western Santa Ana register among the lowest shares at under 5%, creating a sharp demographic boundary with adjacent high-concentration areas just a few miles away.
Data: U.S. Census Bureau, 2023 ACS
Explore
- High School Graduate (% of Over 25) by Zip Code (ZCTA5) — Boston Metro
- Median Age by Zip Code (ZCTA5) — Boston Metro
- U.S. Citizens (% of Population Over 18) by Zip Code (ZCTA5) — Boston Metro
- Population Hispanic % by Zip Code (ZCTA5) — Boston Metro
- Household Median Income by Zip Code (ZCTA5) — Boston Metro
- Population Non-Hispanic Black % by Zip Code (ZCTA5) — Boston Metro
- Population Non-Hispanic American Indian % by Zip Code (ZCTA5) — Boston Metro
- Population Non-Hispanic White % by Zip Code (ZCTA5) — Boston Metro
- % of Population on Food Stamps or SNAP (Last 12 Months), by Zip Code (ZCTA5) — Maryland
- % of Population without Health Insurance, by County
- Median Age by Zip Code (ZCTA5) — Chicago Metro
- Household Median Income by Zip Code (ZCTA5) — Chicago Metro
- Population Non-Hispanic White % by Zip Code (ZCTA5) — Chicago Metro
- % of Population on Food Stamps or SNAP (Last 12 Months), by Zip Code (ZCTA5) — Los Angeles Metro
- U.S. Citizens (% of Population Over 18) by Zip Code (ZCTA5) — Chicago Metro
- Population Non-Hispanic Black % by Zip Code (ZCTA5) — Chicago Metro
- Population Hispanic % by Zip Code (ZCTA5) — Chicago Metro
- Population Non-Hispanic American Indian % by Zip Code (ZCTA5) — Chicago Metro
- High School Graduate (% of Over 25) by Zip Code (ZCTA5) — Chicago Metro
- Housing Owner-Occupied % of Units, by Zip Code (ZCTA5) — Boston Metro
- % of Households with Broadband Internet, by Zip Code (ZCTA5) — Boston Metro
- Housing Owner-Occupied Median Value ($), by Zip Code (ZCTA5) — Boston Metro
- Population Non-Hispanic American Indian % by Zip Code (ZCTA5) — Wisconsin
- Housing Median Monthly Rent ($), by Zip Code (ZCTA5) — Boston Metro
- High School Graduate (% of Over 25) by Zip Code (ZCTA5) — Detroit Metro
- % of Population without Health Insurance, by Zip Code (ZCTA5) — Seattle Metro
- Population Non-Hispanic American Indian % by Zip Code (ZCTA5) — San Francisco Metro
- Bachelor's Degree or Higher (% of Over 25) by Zip Code (ZCTA5) — Boston Metro
- % of Population without Health Insurance, by Zip Code (ZCTA5) — Boston Metro
- Housing Owner-Occupied % of Units, by Zip Code (ZCTA5) — Seattle Metro
- Population Non-Hispanic Asian % by Zip Code (ZCTA5) — St. Louis Metro
- Population Non-Hispanic Asian % by Zip Code (ZCTA5) — Miami Metro
- Population Non-Hispanic Asian % by Zip Code (ZCTA5) — Boston Metro
- Population Non-Hispanic Asian % by Zip Code (ZCTA5) — Houston Metro
- Population Non-Hispanic Asian % by Zip Code (ZCTA5) — Austin Metro
- Population Non-Hispanic Asian % by Zip Code (ZCTA5) — Detroit Metro
- Population Non-Hispanic Asian % by Zip Code (ZCTA5) — Tampa Metro
- Population Non-Hispanic Asian % by Zip Code (ZCTA5) — Atlanta Metro
- Population Non-Hispanic Asian % by Zip Code (ZCTA5) — Chicago Metro
- Population Non-Hispanic Asian % by Zip Code (ZCTA5) — Dallas Metro