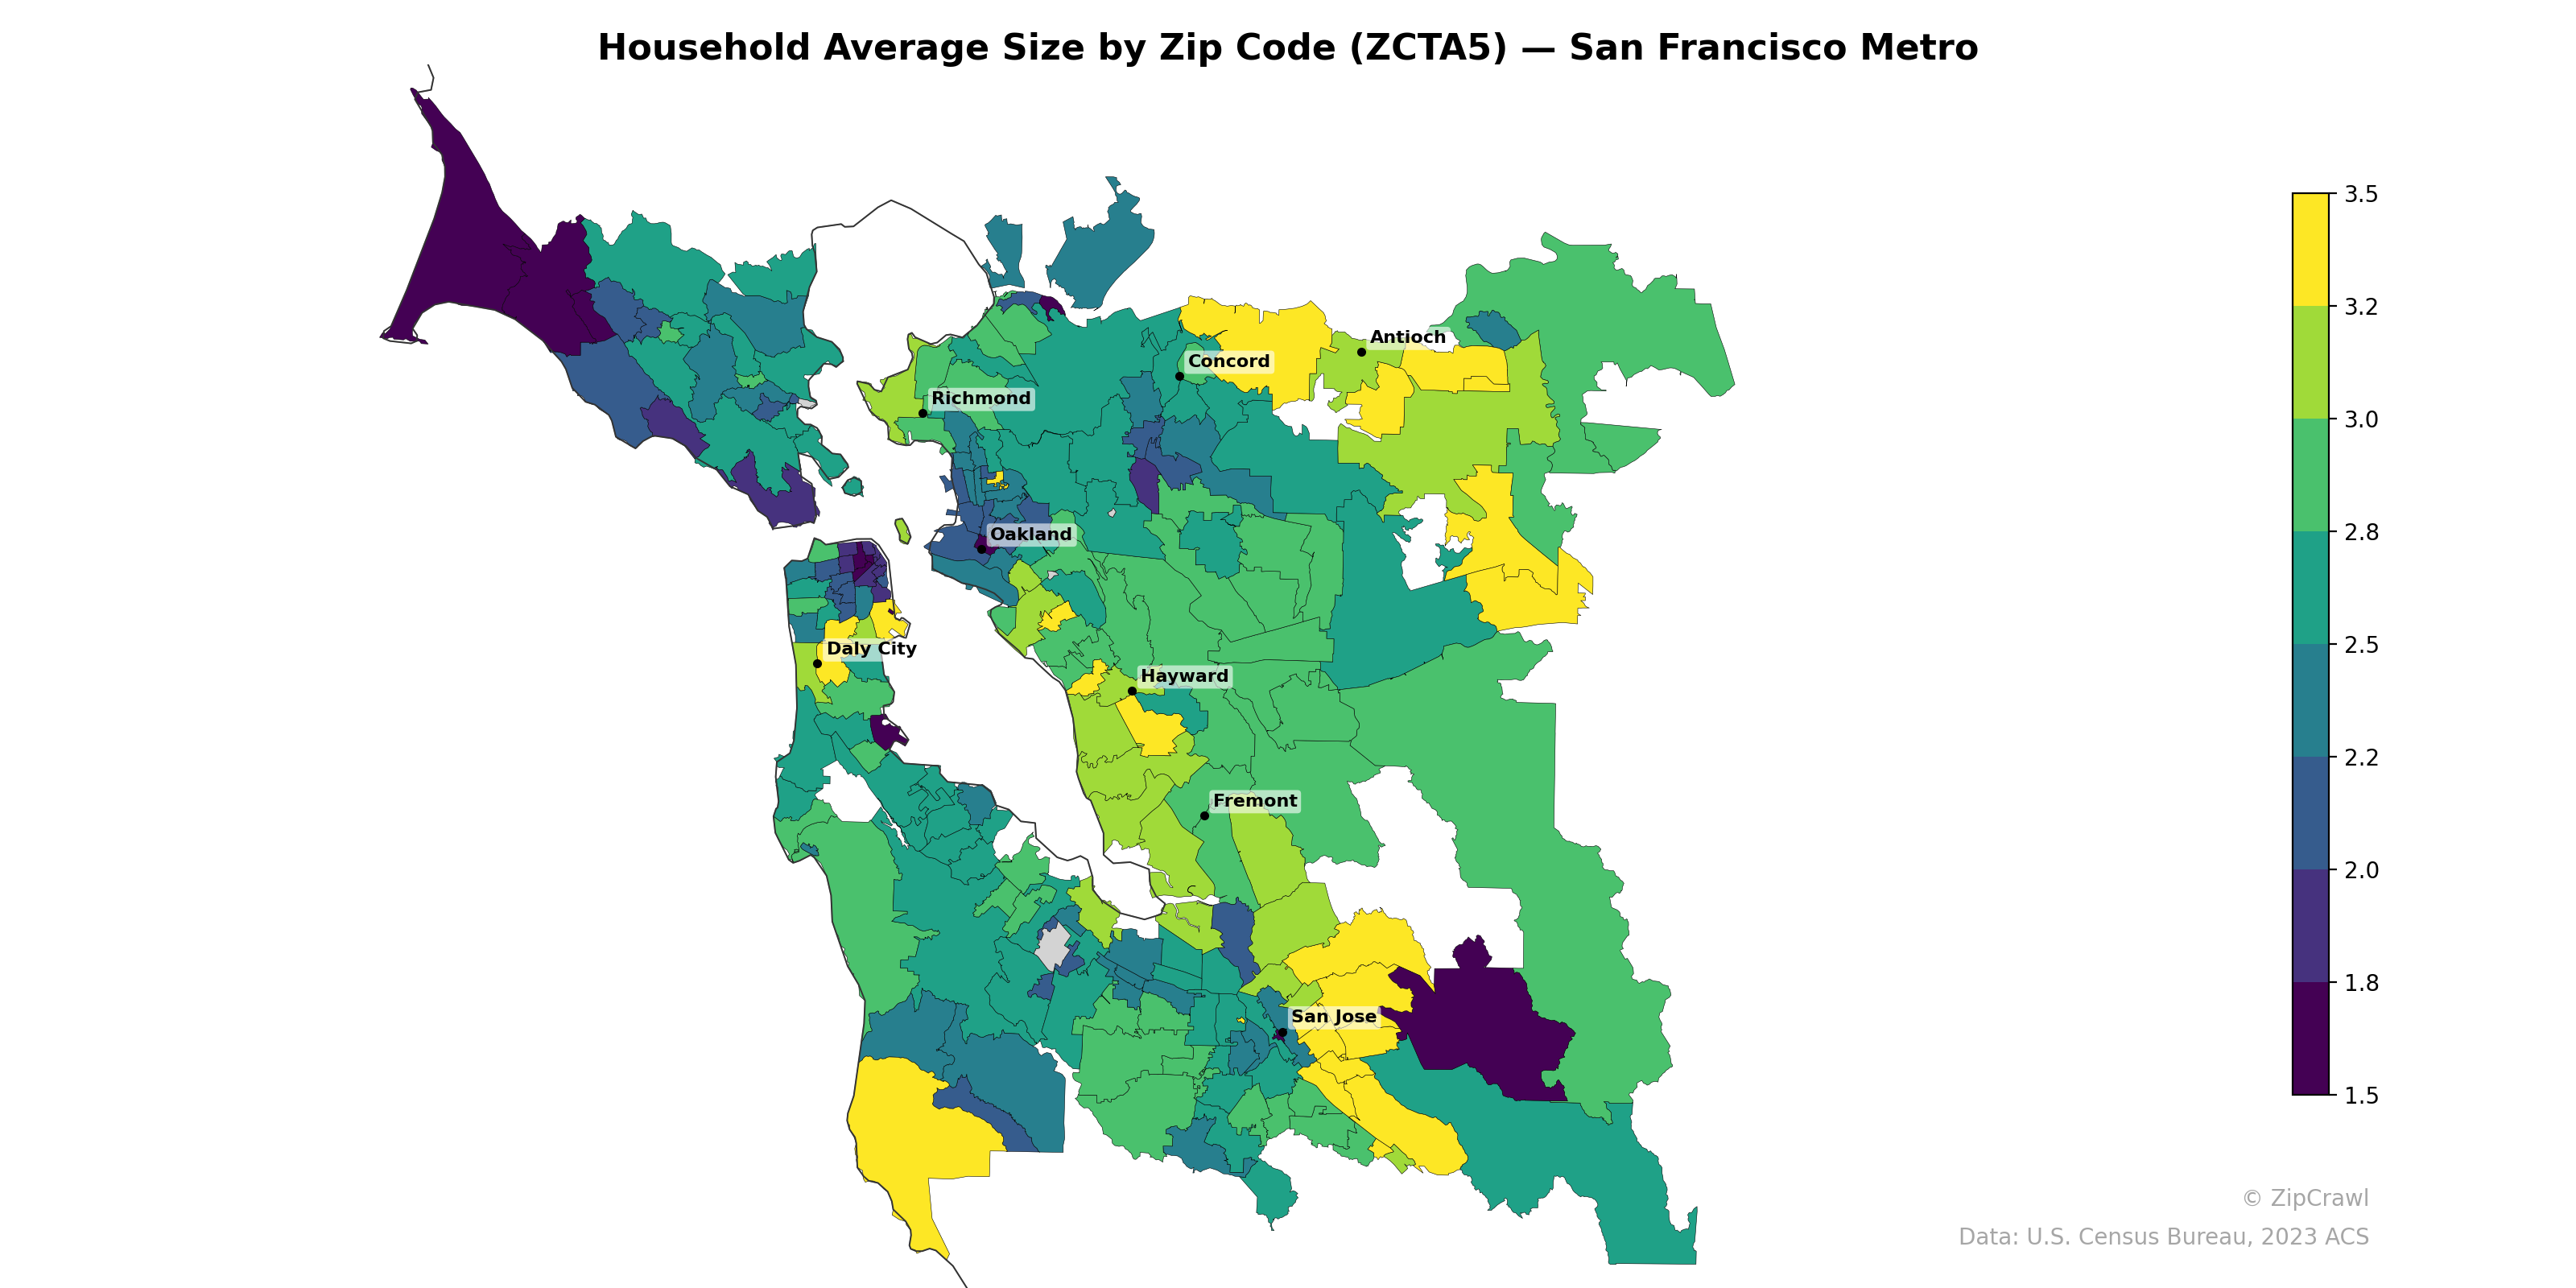
NOTE: Gray indicates insufficient data or a suppressed estimate.
Household sizes in the San Francisco metro skew notably smaller in the urban core, with San Francisco proper and parts of downtown Oakland displaying averages below 2.0, reflecting high concentrations of single-person and couple households. The largest household sizes, exceeding 3.0, cluster in the eastern and southeastern portions of the metro—particularly in zip codes near Antioch, eastern Concord, and pockets of East San Jose and Daly City—areas with higher immigrant populations and more multi-generational living arrangements. A clear gradient emerges moving outward from the urban core, with mid-range values (2.4–2.8) forming a transitional band through suburban communities like Hayward, Fremont, and Richmond.
Data: U.S. Census Bureau, 2023 ACS
Explore
- Household Median Income by Zip Code (ZCTA5) — Chicago Metro
- Housing Median Monthly Rent ($), by Zip Code (ZCTA5) — San Francisco Metro
- % of Population without Health Insurance, by Zip Code (ZCTA5) — San Francisco Metro
- Housing % of Units Built Since 2010, by Zip Code (ZCTA5) — San Francisco Metro
- Housing Owner-Occupied % of Units, by Zip Code (ZCTA5) — San Francisco Metro
- Housing Owner-Occupied Median Value ($), by Zip Code (ZCTA5) — San Francisco Metro
- Married Couple (% of all Households) by Zip Code (ZCTA5) — San Francisco Metro
- Housing Vacancy Rate by Zip Code (ZCTA5) — San Francisco Metro
- % of Households with Broadband Internet, by Zip Code (ZCTA5) — San Francisco Metro
- Bachelor's Degree or Higher (% of Over 25) by Zip Code (ZCTA5) — San Francisco Metro
- Population Non-Hispanic White % by Zip Code (ZCTA5) — Washington D.C.
- % of Population without Health Insurance, by County
- % of Population on Food Stamps or SNAP (Last 12 Months), by Zip Code (ZCTA5) — Los Angeles Metro
- Population Non-Hispanic Asian % by Zip Code (ZCTA5) — Los Angeles Metro
- Median Age by Zip Code (ZCTA5) — Chicago Metro
- Population Hispanic % by Zip Code (ZCTA5) — Chicago Metro
- Married Couple (% of all Households) by Zip Code (ZCTA5) — New York Metro
- Population Non-Hispanic Black % by Zip Code (ZCTA5) — Chicago Metro
- Population Non-Hispanic White % by Zip Code (ZCTA5) — Chicago Metro
- High School Graduate (% of Over 25) by Zip Code (ZCTA5) — Chicago Metro
- Population Non-Hispanic American Indian % by Zip Code (ZCTA5) — Chicago Metro
- U.S. Citizens (% of Population Over 18) by Zip Code (ZCTA5) — Chicago Metro
- % of Population without Health Insurance, by Zip Code (ZCTA5) — Boston Metro
- Bachelor's Degree or Higher (% of Over 25) by Zip Code (ZCTA5) — Boston Metro
- Housing Owner-Occupied % of Units, by Zip Code (ZCTA5) — Boston Metro
- Median Age by Zip Code (ZCTA5) — Boston Metro
- Population Non-Hispanic Black % by Zip Code (ZCTA5) — Boston Metro
- Population Non-Hispanic American Indian % by Zip Code (ZCTA5) — Boston Metro
- % of Households with Broadband Internet, by Zip Code (ZCTA5) — Boston Metro
- Household Median Income by Zip Code (ZCTA5) — Boston Metro
- Household Average Size by Zip Code (ZCTA5) — San Diego Metro
- Household Average Size by Zip Code (ZCTA5) — San Antonio Metro
- Household Average Size by Zip Code (ZCTA5) — Houston Metro
- Household Average Size by Zip Code (ZCTA5) — Miami Metro
- Household Average Size by Zip Code (ZCTA5) — Detroit Metro
- Household Average Size by Zip Code (ZCTA5) — Austin Metro
- Household Average Size by Zip Code (ZCTA5) — Boston Metro
- Household Average Size by Zip Code (ZCTA5) — Denver Metro
- Household Average Size by Zip Code (ZCTA5) — Tampa Metro
- Household Average Size by Zip Code (ZCTA5) — Chicago Metro