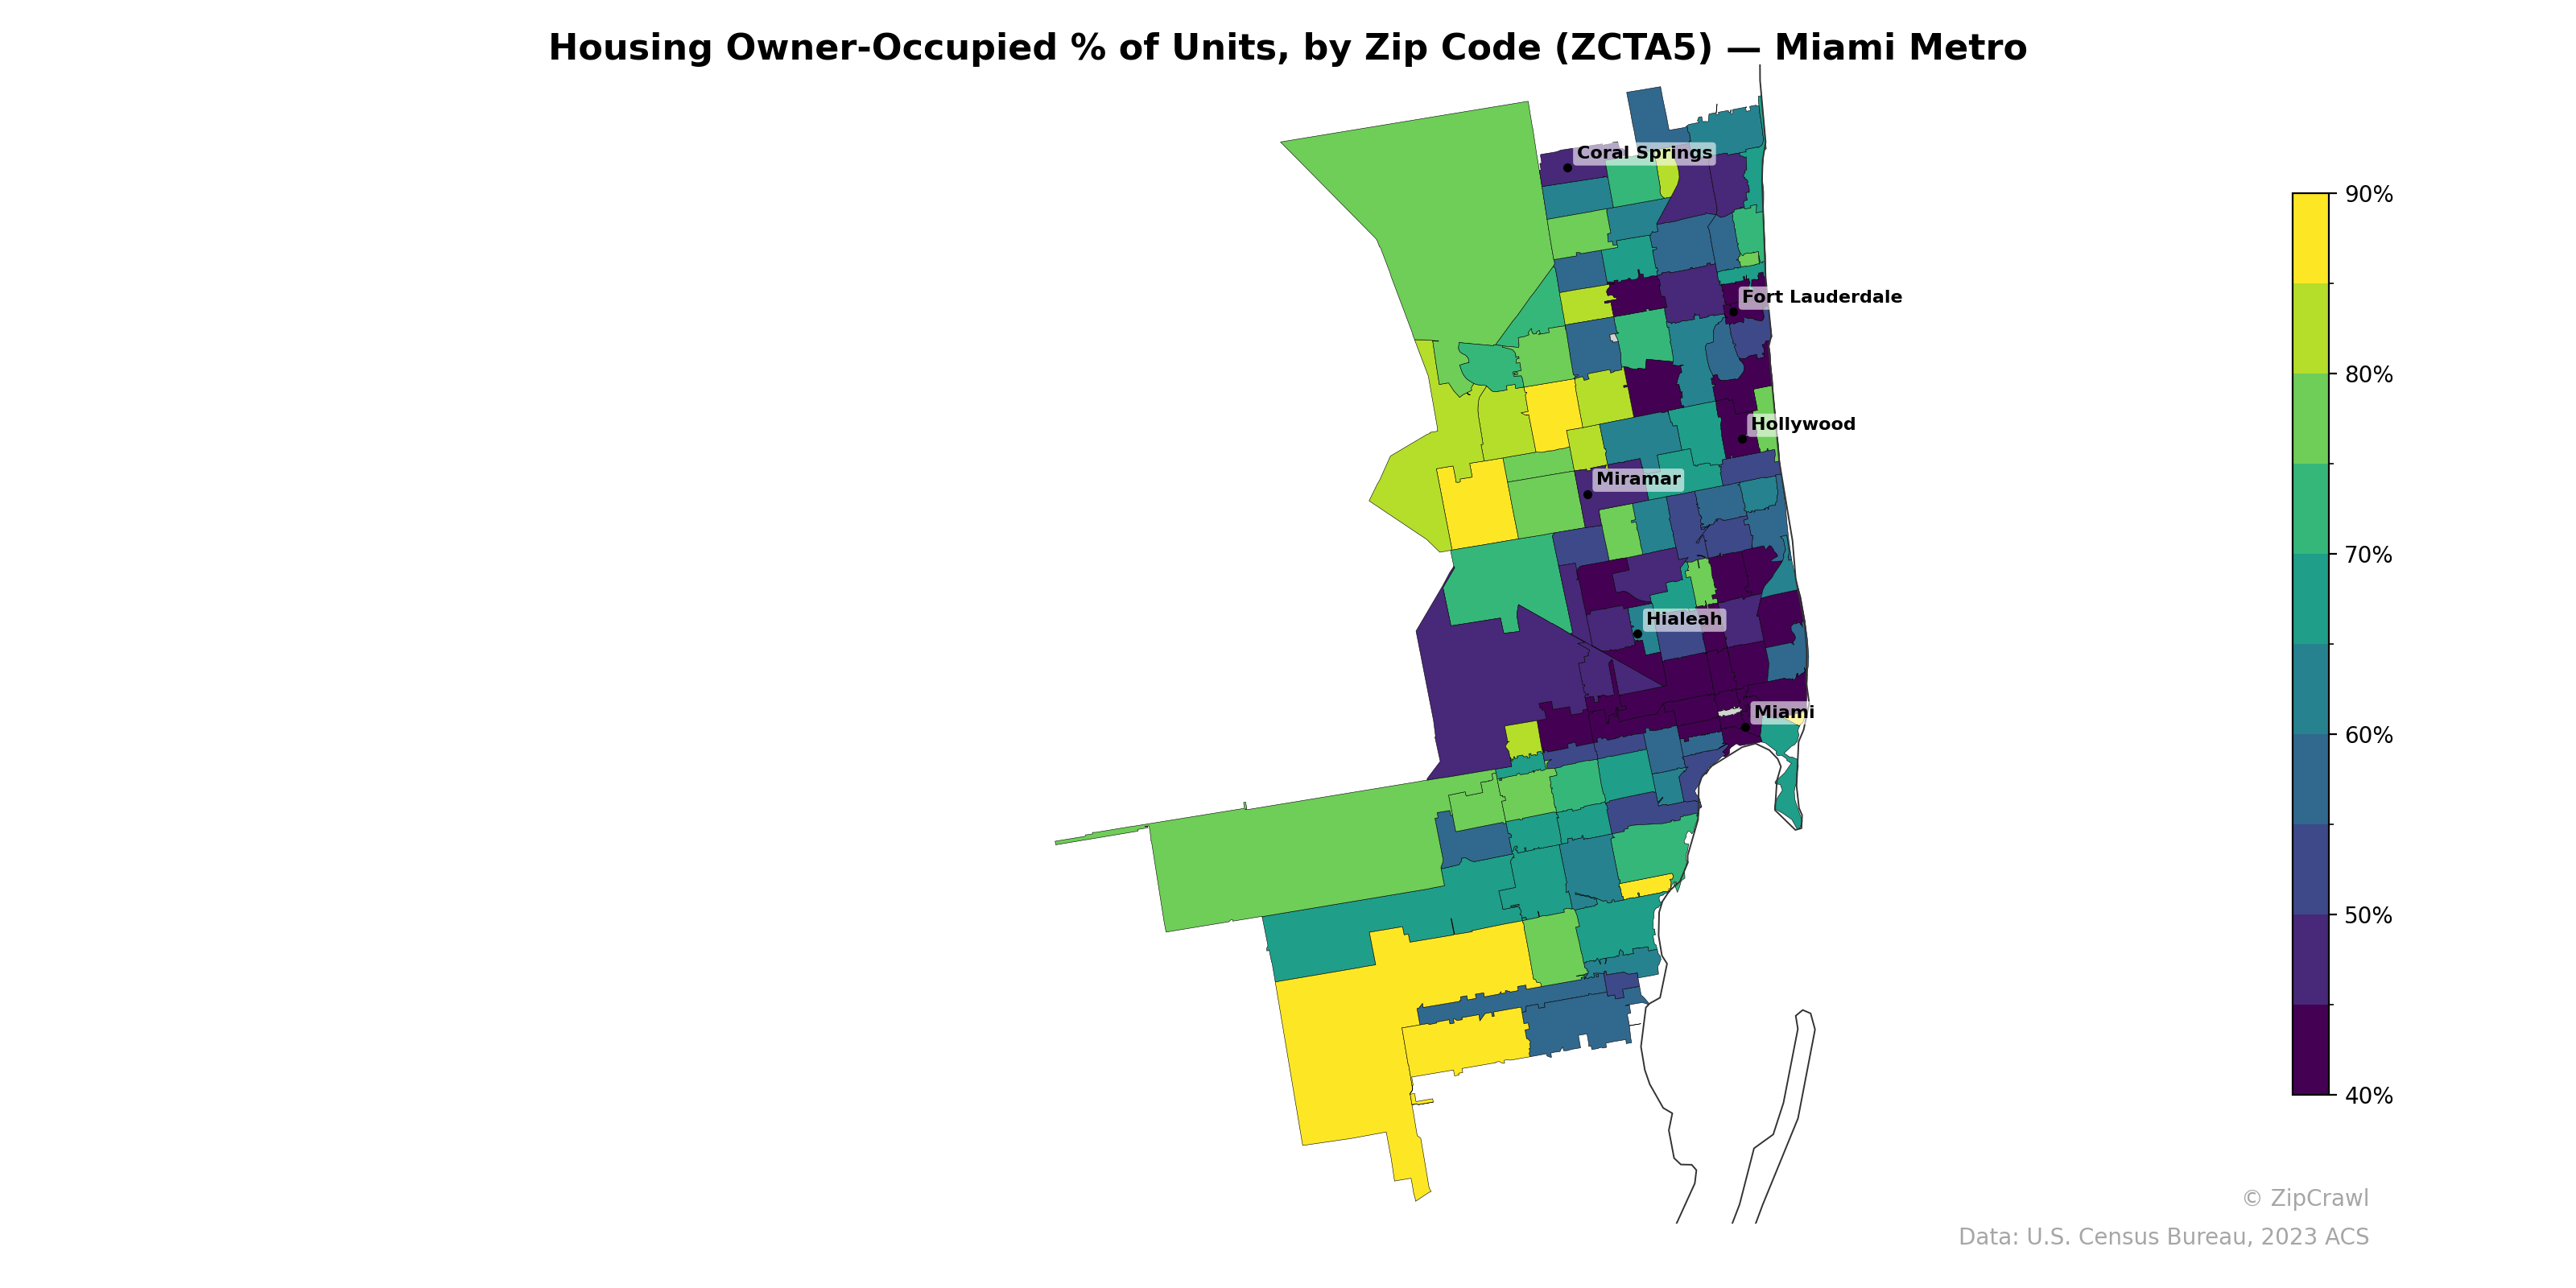
NOTE: Gray indicates insufficient data or a suppressed estimate.
Owner-occupancy rates in the Miami metro follow a clear suburban-to-urban gradient, with the highest concentrations (85–90%+) clustered in the western and southwestern suburban zip codes, particularly in the Homestead area and communities west of Coral Springs and Miramar. Coastal zip codes from Miami Beach through Fort Lauderdale consistently register among the lowest owner-occupancy rates (below 45%), reflecting the dominance of rental and seasonal housing in beachfront areas. The urban core around downtown Miami and Hialeah displays a patchwork of predominantly low owner-occupancy zones, punctuated by occasional moderate-rate zip codes, suggesting localized variation driven by housing stock type and demographic composition.
Data: U.S. Census Bureau, 2023 ACS
Explore
- Bachelor's Degree or Higher (% of Over 25) by Zip Code (ZCTA5) — New York Metro
- Housing Vacancy Rate by Zip Code (ZCTA5) — Miami Metro
- Housing Owner-Occupied Median Value ($), by Zip Code (ZCTA5) — Miami Metro
- Housing Median Monthly Rent ($), by Zip Code (ZCTA5) — Miami Metro
- Married Couple (% of all Households) by Zip Code (ZCTA5) — Miami Metro
- Household Average Size by Zip Code (ZCTA5) — Miami Metro
- Housing % of Units Built Since 2010, by Zip Code (ZCTA5) — Miami Metro
- Bachelor's Degree or Higher (% of Over 25) by Zip Code (ZCTA5) — Miami Metro
- % of Population without Health Insurance, by Zip Code (ZCTA5) — Miami Metro
- % of Households with Broadband Internet, by Zip Code (ZCTA5) — Miami Metro
- % of Population on Food Stamps or SNAP (Last 12 Months), by Zip Code (ZCTA5) — Arkansas
- Median Age by County
- U.S. Citizens (% of Population Over 18) by Zip Code (ZCTA5) — New York Metro
- Population Hispanic % by Zip Code (ZCTA5) — New York Metro
- Population Non-Hispanic White % by Zip Code (ZCTA5) — New York Metro
- High School Graduate (% of Over 25) by Zip Code (ZCTA5) — New York Metro
- % of Population on Food Stamps or SNAP (Last 12 Months), by County
- Median Age by Zip Code (ZCTA5) — New York Metro
- Population Non-Hispanic Black % by Zip Code (ZCTA5) — New York Metro
- Household Median Income by Zip Code (ZCTA5) — New York Metro
- Population Non-Hispanic American Indian % by Zip Code (ZCTA5) — New York Metro
- Housing Owner-Occupied Median Value ($), by Zip Code (ZCTA5) — Ohio
- % of Households with Broadband Internet, by Zip Code (ZCTA5) — Ohio
- Housing Median Monthly Rent ($), by Zip Code (ZCTA5) — Ohio
- Population Hispanic % by Zip Code (ZCTA5) — Ohio
- Population Non-Hispanic White % by Zip Code (ZCTA5) — Ohio
- High School Graduate (% of Over 25) by Zip Code (ZCTA5) — Ohio
- Bachelor's Degree or Higher (% of Over 25) by Zip Code (ZCTA5) — Ohio
- % of Population without Health Insurance, by Zip Code (ZCTA5) — Ohio
- Population Non-Hispanic Black % by Zip Code (ZCTA5) — Ohio
- Housing Owner-Occupied % of Units, by Zip Code (ZCTA5) — Houston Metro
- Housing Owner-Occupied % of Units, by Zip Code (ZCTA5) — Boston Metro
- Housing Owner-Occupied % of Units, by Zip Code (ZCTA5) — Tampa Metro
- Housing Owner-Occupied % of Units, by Zip Code (ZCTA5) — Denver Metro
- Housing Owner-Occupied % of Units, by Zip Code (ZCTA5) — Detroit Metro
- Housing Owner-Occupied % of Units, by Zip Code (ZCTA5) — Dallas Metro
- Housing Owner-Occupied % of Units, by Zip Code (ZCTA5) — Austin Metro
- Housing Owner-Occupied % of Units, by Zip Code (ZCTA5) — Chicago Metro
- Housing Owner-Occupied % of Units, by Zip Code (ZCTA5) — Orlando Metro
- Housing Owner-Occupied % of Units, by Zip Code (ZCTA5) — Atlanta Metro