NOTE: Gray indicates insufficient data or a suppressed estimate.
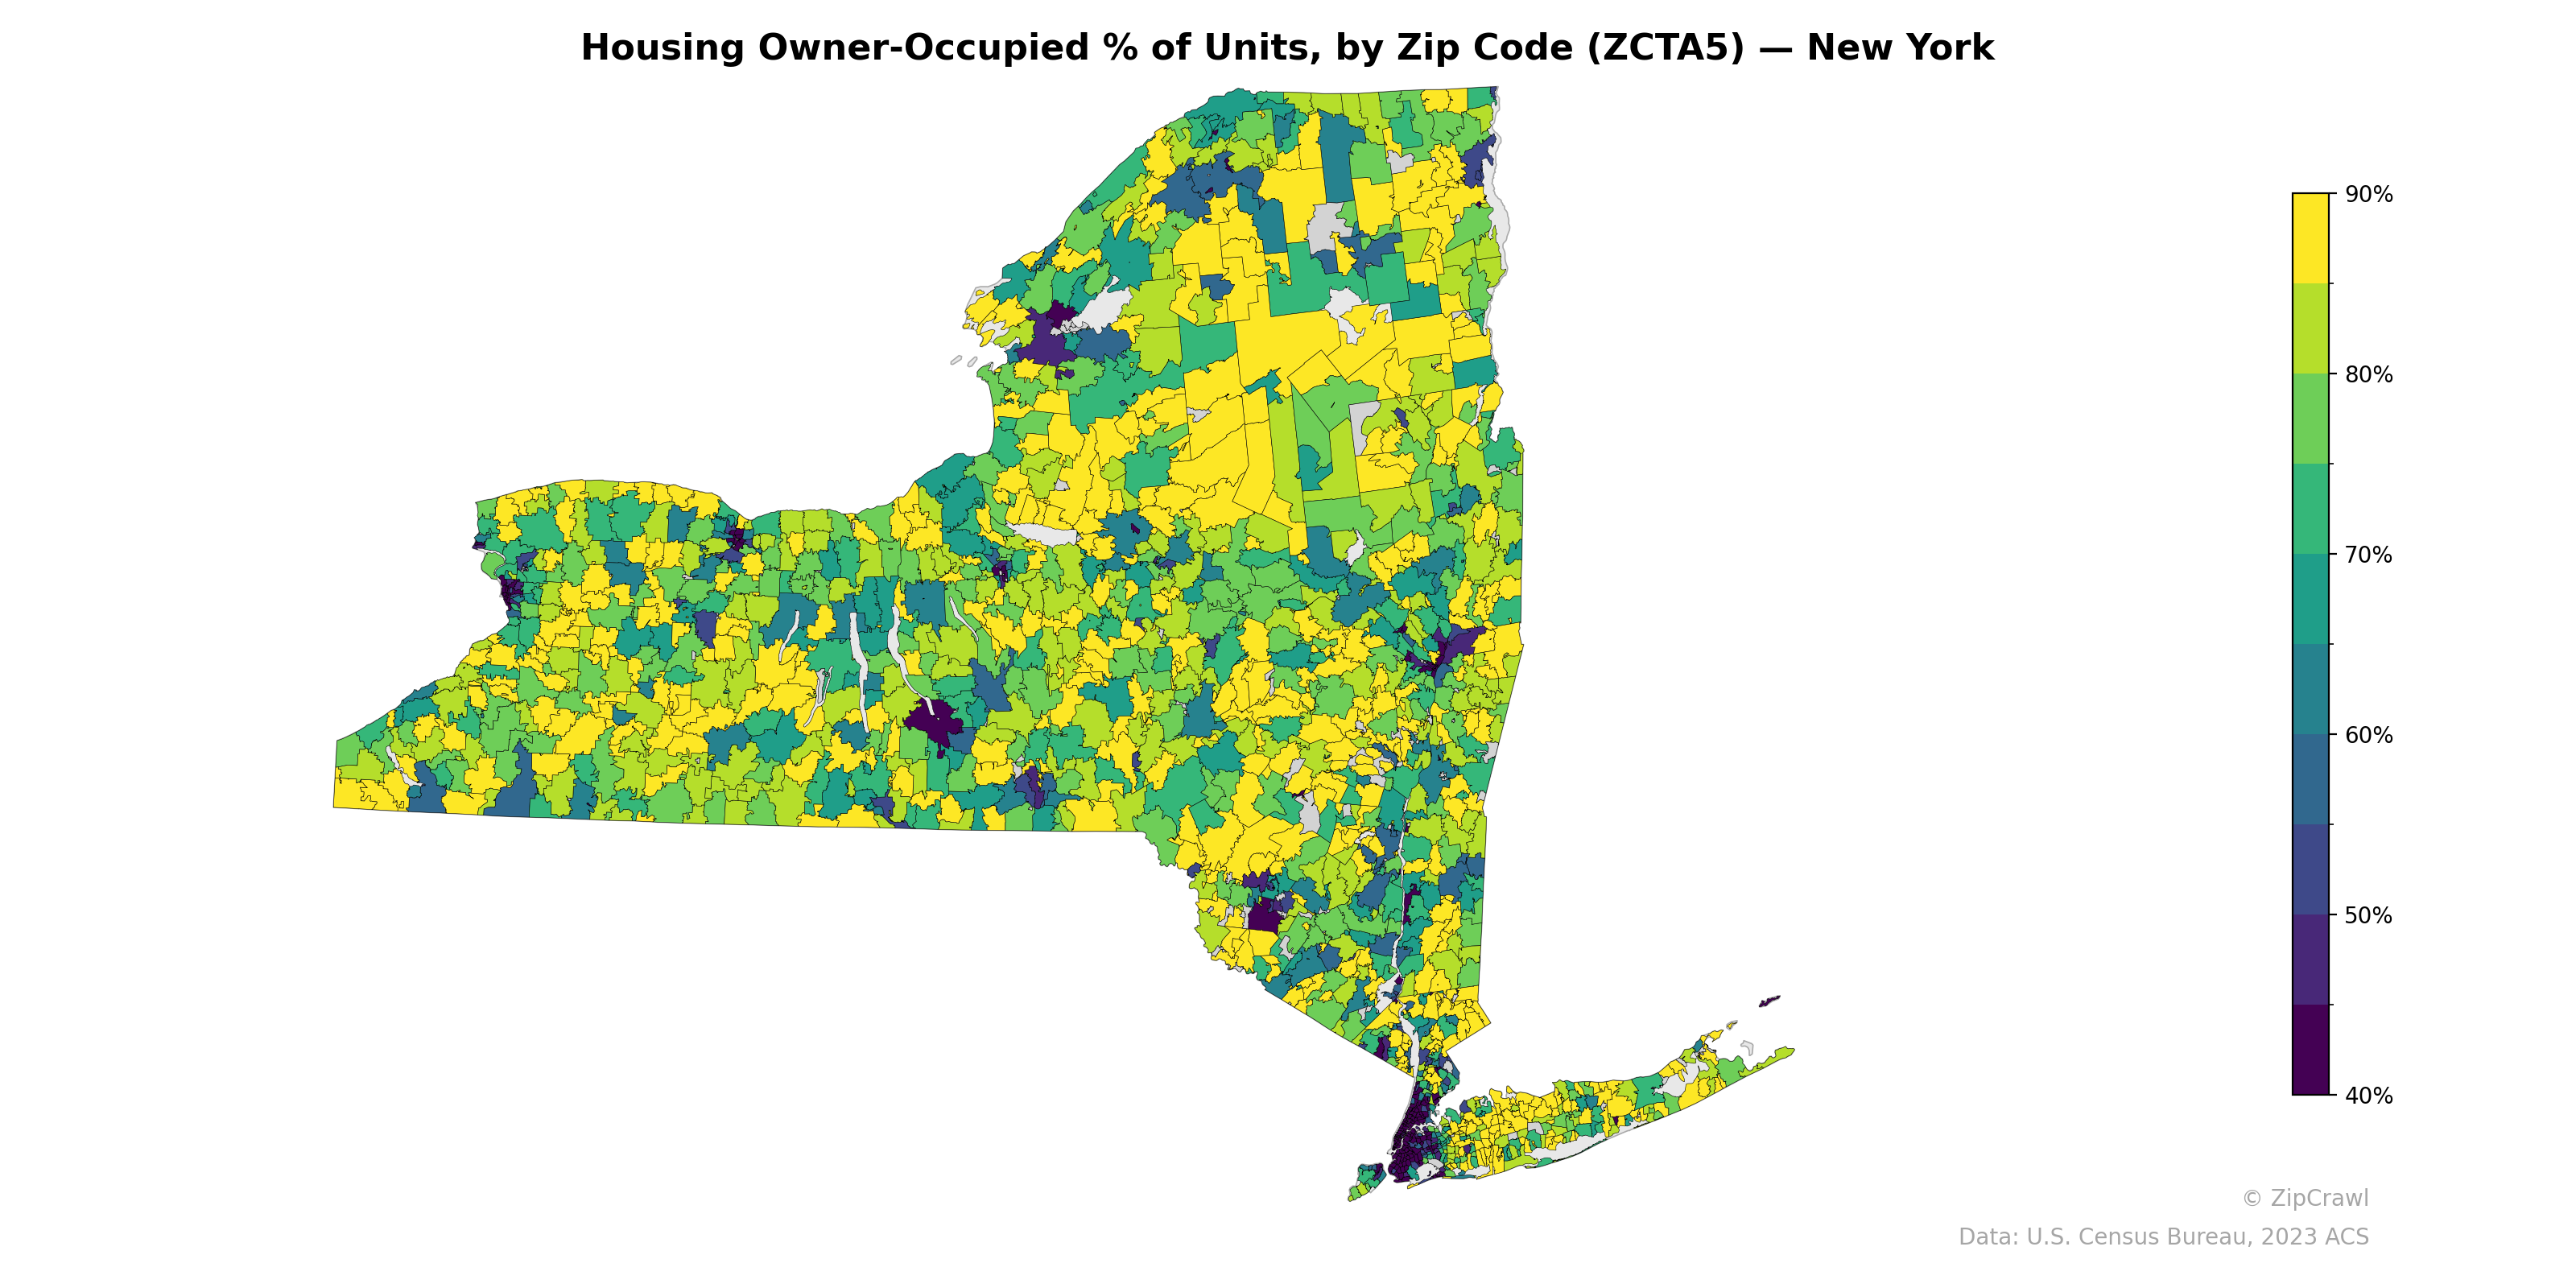
New York City and its immediate surroundings exhibit the lowest owner-occupancy rates in the state, with many zip codes falling below 40%, reflecting the dominance of rental housing in dense urban markets. Upstate and rural regions across the Southern Tier, Finger Lakes, and North Country consistently display owner-occupancy rates above 80%, characteristic of lower-density, single-family housing markets. Notable pockets of lower ownership also cluster around mid-sized cities such as Syracuse, Rochester, Buffalo, and Albany, creating a visible contrast against their surrounding suburban and rural zip codes.
Data: U.S. Census Bureau, 2023 ACS
Explore
- Population Non-Hispanic White % by Zip Code (ZCTA5) — South Dakota
- % of Population on Food Stamps or SNAP (Last 12 Months), by Zip Code (ZCTA5) — South Dakota
- % of Population on Food Stamps or SNAP (Last 12 Months), by Zip Code (ZCTA5) — Delaware
- Married Couple (% of all Households) by Zip Code (ZCTA5) — Delaware
- Population Non-Hispanic Black % by Zip Code (ZCTA5) — South Dakota
- Median Age by Zip Code (ZCTA5) — South Dakota
- Household Median Income by Zip Code (ZCTA5) — South Dakota
- U.S. Citizens (% of Population Over 18) by Zip Code (ZCTA5) — South Dakota
- Housing Vacancy Rate by Zip Code (ZCTA5) — Delaware
- Population Non-Hispanic Asian % by Zip Code (ZCTA5) — Delaware
- Population Hispanic % by Zip Code (ZCTA5) — South Dakota
- Household Average Size by County
- Housing Median Monthly Rent ($), by Zip Code (ZCTA5) — New York
- Housing % of Units Built Since 2010, by Zip Code (ZCTA5) — New York
- Housing Owner-Occupied Median Value ($), by Zip Code (ZCTA5) — New York
- Household Average Size by Zip Code (ZCTA5) — New York
- Housing Vacancy Rate by Zip Code (ZCTA5) — New York
- Bachelor's Degree or Higher (% of Over 25) by Zip Code (ZCTA5) — New York
- % of Households with Broadband Internet, by Zip Code (ZCTA5) — New York
- % of Population without Health Insurance, by Zip Code (ZCTA5) — New York
- Married Couple (% of all Households) by Zip Code (ZCTA5) — New York
- High School Graduate (% of Over 25) by Zip Code (ZCTA5) — Rhode Island
- % of Population on Food Stamps or SNAP (Last 12 Months), by Zip Code (ZCTA5) — New Hampshire
- Married Couple (% of all Households) by Zip Code (ZCTA5) — Rhode Island
- Population Non-Hispanic Black % by Zip Code (ZCTA5) — North Dakota
- Housing Vacancy Rate by Zip Code (ZCTA5) — Alaska
- Bachelor's Degree or Higher (% of Over 25) by Zip Code (ZCTA5) — Rhode Island
- Population Non-Hispanic American Indian % by Zip Code (ZCTA5) — North Dakota
- Population Non-Hispanic American Indian % by Zip Code (ZCTA5) — Rhode Island
- % of Population on Food Stamps or SNAP (Last 12 Months), by Zip Code (ZCTA5) — Kentucky
- Housing Owner-Occupied % of Units, by Zip Code (ZCTA5) — New Mexico
- Housing Owner-Occupied % of Units, by Zip Code (ZCTA5) — New Jersey
- Housing Owner-Occupied % of Units, by Zip Code (ZCTA5) — Nevada
- Housing Owner-Occupied % of Units, by Zip Code (ZCTA5) — New Hampshire
- Housing Owner-Occupied % of Units, by Zip Code (ZCTA5) — Utah
- Housing Owner-Occupied % of Units, by Zip Code (ZCTA5) — Ohio
- Housing Owner-Occupied % of Units, by Zip Code (ZCTA5) — Nebraska
- Housing Owner-Occupied % of Units, by Zip Code (ZCTA5) — Iowa
- Housing Owner-Occupied % of Units, by Zip Code (ZCTA5) — Texas
- Housing Owner-Occupied % of Units, by Zip Code (ZCTA5) — Oregon