NOTE: Gray indicates insufficient data or a suppressed estimate.
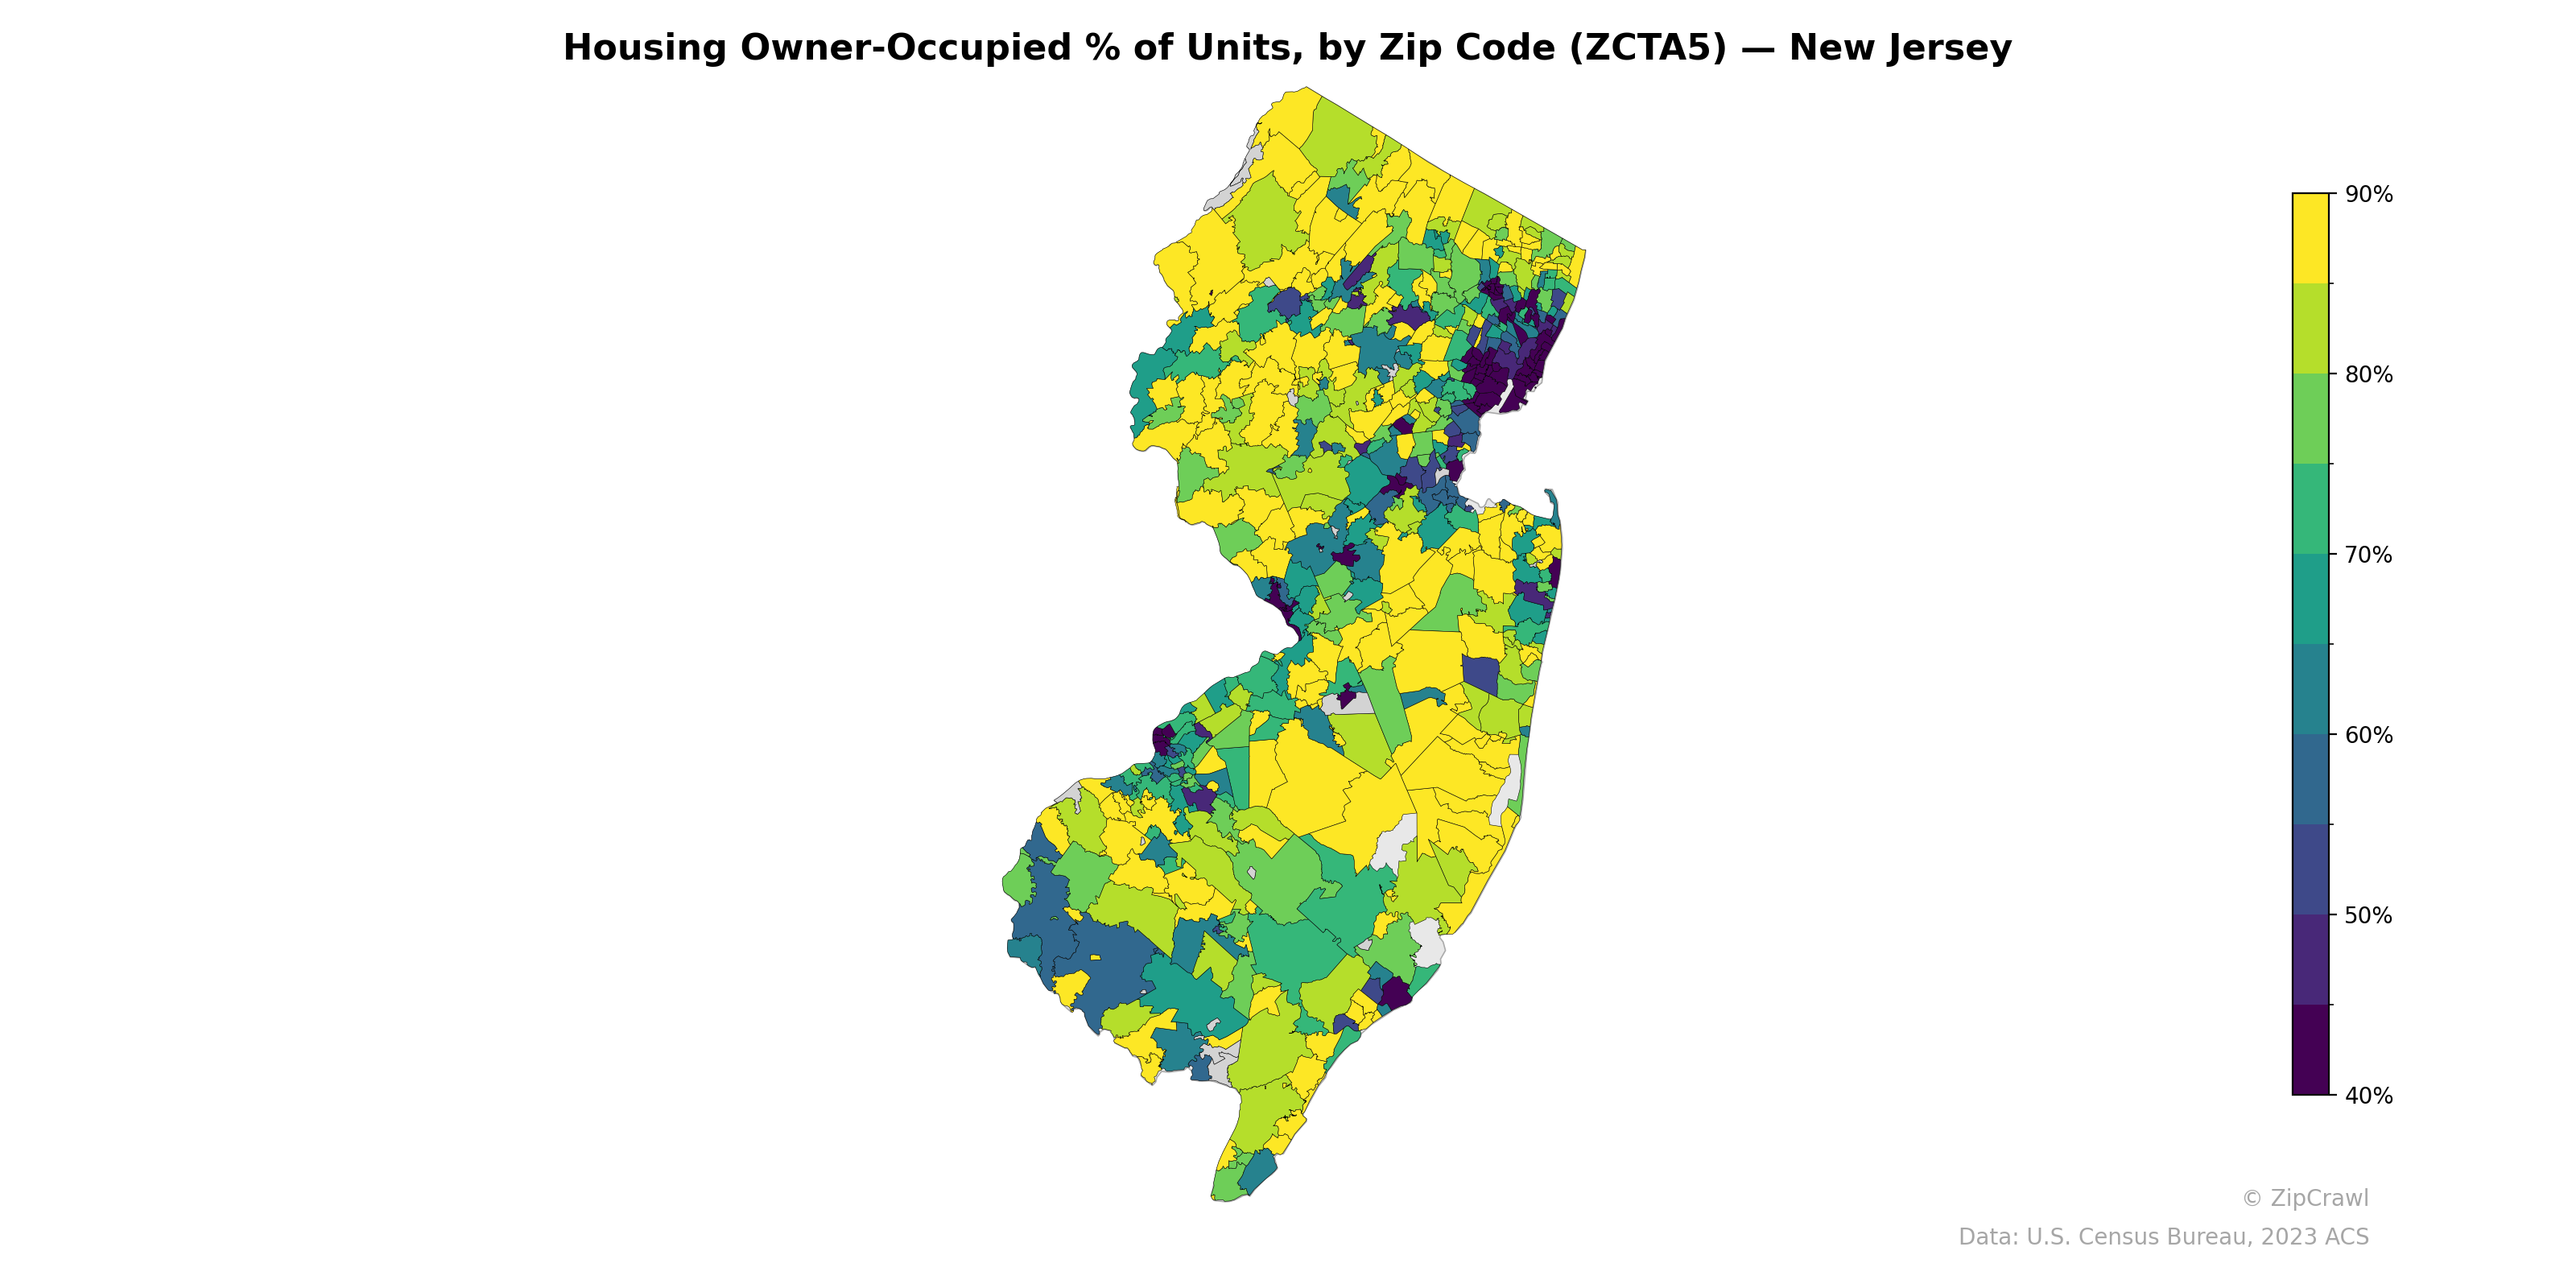
Owner-occupancy rates in New Jersey exhibit a clear suburban-urban divide, with the highest concentrations (85–90%+) clustered in the northwestern rural and exurban zip codes as well as parts of central Monmouth and Ocean counties, while the lowest rates (below 40–50%) concentrate along the urban corridor spanning Newark, Jersey City, Paterson, and other Hudson and Essex County communities. The southern Shore communities, particularly around Atlantic City and Cape May, also display notably depressed owner-occupancy rates, likely reflecting the prevalence of seasonal rental and vacation housing stock. A patchwork pattern is evident in central New Jersey, where high-ownership suburban zip codes sit immediately adjacent to lower-ownership areas anchored by smaller cities like Trenton and New Brunswick.
Data: U.S. Census Bureau, 2023 ACS
Explore
- Housing % of Units Built Since 2010, by Zip Code (ZCTA5) — New York Metro
- Housing Vacancy Rate by Zip Code (ZCTA5) — New Jersey
- Housing Median Monthly Rent ($), by Zip Code (ZCTA5) — New Jersey
- Married Couple (% of all Households) by Zip Code (ZCTA5) — New Jersey
- % of Households with Broadband Internet, by Zip Code (ZCTA5) — New Jersey
- % of Population without Health Insurance, by Zip Code (ZCTA5) — New Jersey
- Housing % of Units Built Since 2010, by Zip Code (ZCTA5) — New Jersey
- Bachelor's Degree or Higher (% of Over 25) by Zip Code (ZCTA5) — New Jersey
- Household Average Size by Zip Code (ZCTA5) — New Jersey
- Housing Owner-Occupied Median Value ($), by Zip Code (ZCTA5) — New Jersey
- % of Population on Food Stamps or SNAP (Last 12 Months), by Zip Code (ZCTA5) — New Mexico
- Population Non-Hispanic White % by County
- % of Population without Health Insurance, by Zip Code (ZCTA5) — New York Metro
- Population Non-Hispanic Asian % by Zip Code (ZCTA5) — New York Metro
- Housing Vacancy Rate by Zip Code (ZCTA5) — New York Metro
- Household Average Size by Zip Code (ZCTA5) — New York Metro
- Housing Owner-Occupied Median Value ($), by Zip Code (ZCTA5) — New York Metro
- Housing Median Monthly Rent ($), by Zip Code (ZCTA5) — New York Metro
- % of Households with Broadband Internet, by Zip Code (ZCTA5) — New York Metro
- Married Couple (% of all Households) by Zip Code (ZCTA5) — New York Metro
- Married Couple (% of all Households) by Zip Code (ZCTA5) — North Carolina
- Housing % of Units Built Since 2010, by Zip Code (ZCTA5) — North Carolina
- Housing Vacancy Rate by Zip Code (ZCTA5) — North Carolina
- Bachelor's Degree or Higher (% of Over 25) by Zip Code (ZCTA5) — North Carolina
- High School Graduate (% of Over 25) by Zip Code (ZCTA5) — North Carolina
- % of Households with Broadband Internet, by Zip Code (ZCTA5) — North Carolina
- Housing Owner-Occupied Median Value ($), by Zip Code (ZCTA5) — North Carolina
- Housing Median Monthly Rent ($), by Zip Code (ZCTA5) — North Carolina
- Household Average Size by Zip Code (ZCTA5) — North Carolina
- Population Non-Hispanic Black % by Zip Code (ZCTA5) — North Carolina
- Housing Owner-Occupied % of Units, by Zip Code (ZCTA5) — New York
- Housing Owner-Occupied % of Units, by Zip Code (ZCTA5) — New Mexico
- Housing Owner-Occupied % of Units, by Zip Code (ZCTA5) — Nevada
- Housing Owner-Occupied % of Units, by Zip Code (ZCTA5) — New Hampshire
- Housing Owner-Occupied % of Units, by Zip Code (ZCTA5) — Utah
- Housing Owner-Occupied % of Units, by Zip Code (ZCTA5) — Ohio
- Housing Owner-Occupied % of Units, by Zip Code (ZCTA5) — Nebraska
- Housing Owner-Occupied % of Units, by Zip Code (ZCTA5) — Iowa
- Housing Owner-Occupied % of Units, by Zip Code (ZCTA5) — Texas
- Housing Owner-Occupied % of Units, by Zip Code (ZCTA5) — Oregon