NOTE: Gray indicates insufficient data or a suppressed estimate.
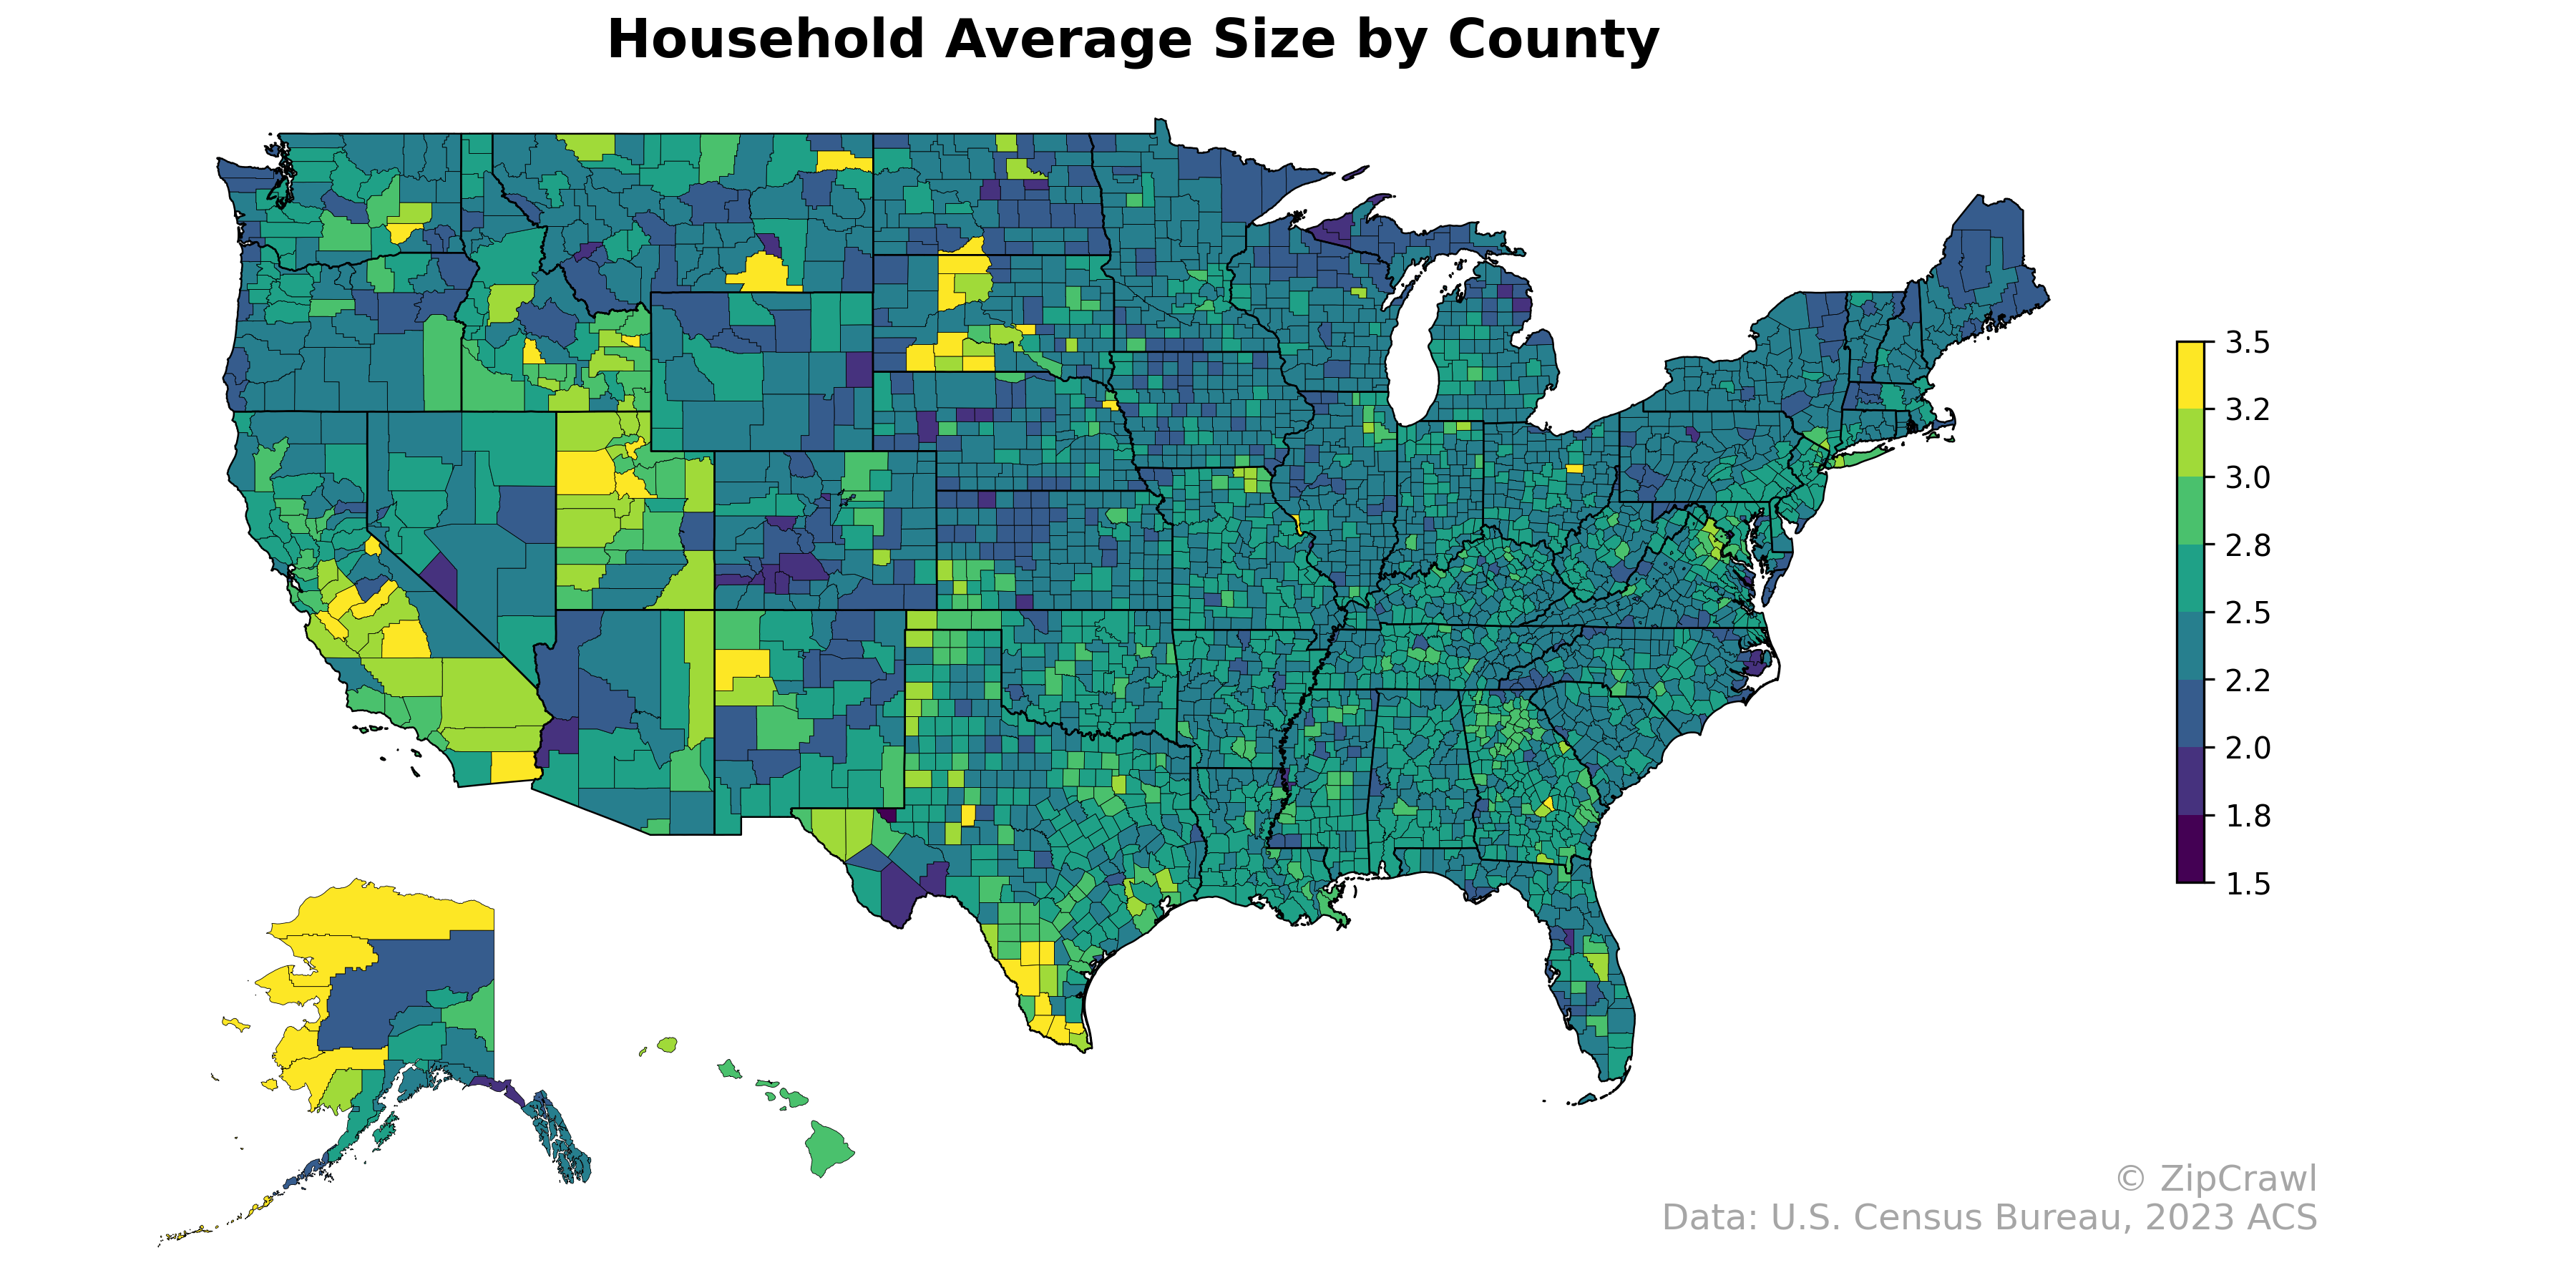
Discover how household size varies across American counties, reflecting the intersection of immigration patterns, religious traditions, housing costs, and aging demographics. This map captures where multigenerational living and large families remain the norm versus where single-person and empty-nester households dominate - a divide that shapes everything from school enrollment projections to housing demand and retail spending patterns.
Data: U.S. Census Bureau, 2023 ACS
Explore
- Household Median Income by Zip Code (ZCTA5) — Delaware
- Bachelor's Degree or Higher (% of Over 25) by Zip Code (ZCTA5) — New York
- Married Couple (% of all Households) by Zip Code (ZCTA5) — New York
- % of Population without Health Insurance, by Zip Code (ZCTA5) — New York
- % of Households with Broadband Internet, by Zip Code (ZCTA5) — New York
- Housing Owner-Occupied % of Units, by Zip Code (ZCTA5) — New York
- Housing % of Units Built Since 2010, by Zip Code (ZCTA5) — New York
- Housing Median Monthly Rent ($), by Zip Code (ZCTA5) — California
- Housing Median Monthly Rent ($), by Zip Code (ZCTA5) — New York
- Housing Owner-Occupied Median Value ($), by Zip Code (ZCTA5) — New York
- Housing Vacancy Rate by Zip Code (ZCTA5) — New York
- Population Non-Hispanic American Indian % by Zip Code (ZCTA5) — Rhode Island
- Married Couple (% of all Households) by Zip Code (ZCTA5) — Rhode Island
- Housing % of Units Built Since 2010, by Zip Code (ZCTA5) — Rhode Island
- High School Graduate (% of Over 25) by Zip Code (ZCTA5) — Rhode Island
- Housing Vacancy Rate by Zip Code (ZCTA5) — Alaska
- Housing Median Monthly Rent ($), by Zip Code (ZCTA5) — Rhode Island
- Housing Vacancy Rate by Zip Code (ZCTA5) — Rhode Island
- % of Population without Health Insurance, by Zip Code (ZCTA5) — Rhode Island
- Housing Owner-Occupied % of Units, by Zip Code (ZCTA5) — Rhode Island
- Bachelor's Degree or Higher (% of Over 25) by Zip Code (ZCTA5) — Rhode Island
- Household Median Income by Zip Code (ZCTA5) — Louisiana
- Household Median Income by Zip Code (ZCTA5) — Utah
- % of Households with Broadband Internet, by Zip Code (ZCTA5) — Rhode Island
- Population Non-Hispanic Black % by Zip Code (ZCTA5) — North Dakota
- Housing Owner-Occupied Median Value ($), by Zip Code (ZCTA5) — Rhode Island
- Household Median Income by Zip Code (ZCTA5) — Hawaii
- Household Median Income by Zip Code (ZCTA5) — Kansas
- Population Non-Hispanic American Indian % by Zip Code (ZCTA5) — North Dakota
- Population Non-Hispanic Asian % by Zip Code (ZCTA5) — Rhode Island
- Household Average Size by Zip Code (ZCTA5) — Utah
- Household Average Size by Zip Code (ZCTA5) — Iowa
- Household Average Size by Zip Code (ZCTA5) — Ohio
- Household Average Size by Zip Code (ZCTA5) — Texas
- Household Average Size by Zip Code (ZCTA5) — Hawaii
- Household Average Size by Zip Code (ZCTA5) — Alaska
- Household Average Size by Zip Code (ZCTA5) — Idaho
- Household Average Size by Zip Code (ZCTA5) — Maine
- Household Average Size by Zip Code (ZCTA5) — Alabama
- Household Average Size by Zip Code (ZCTA5) — Nevada