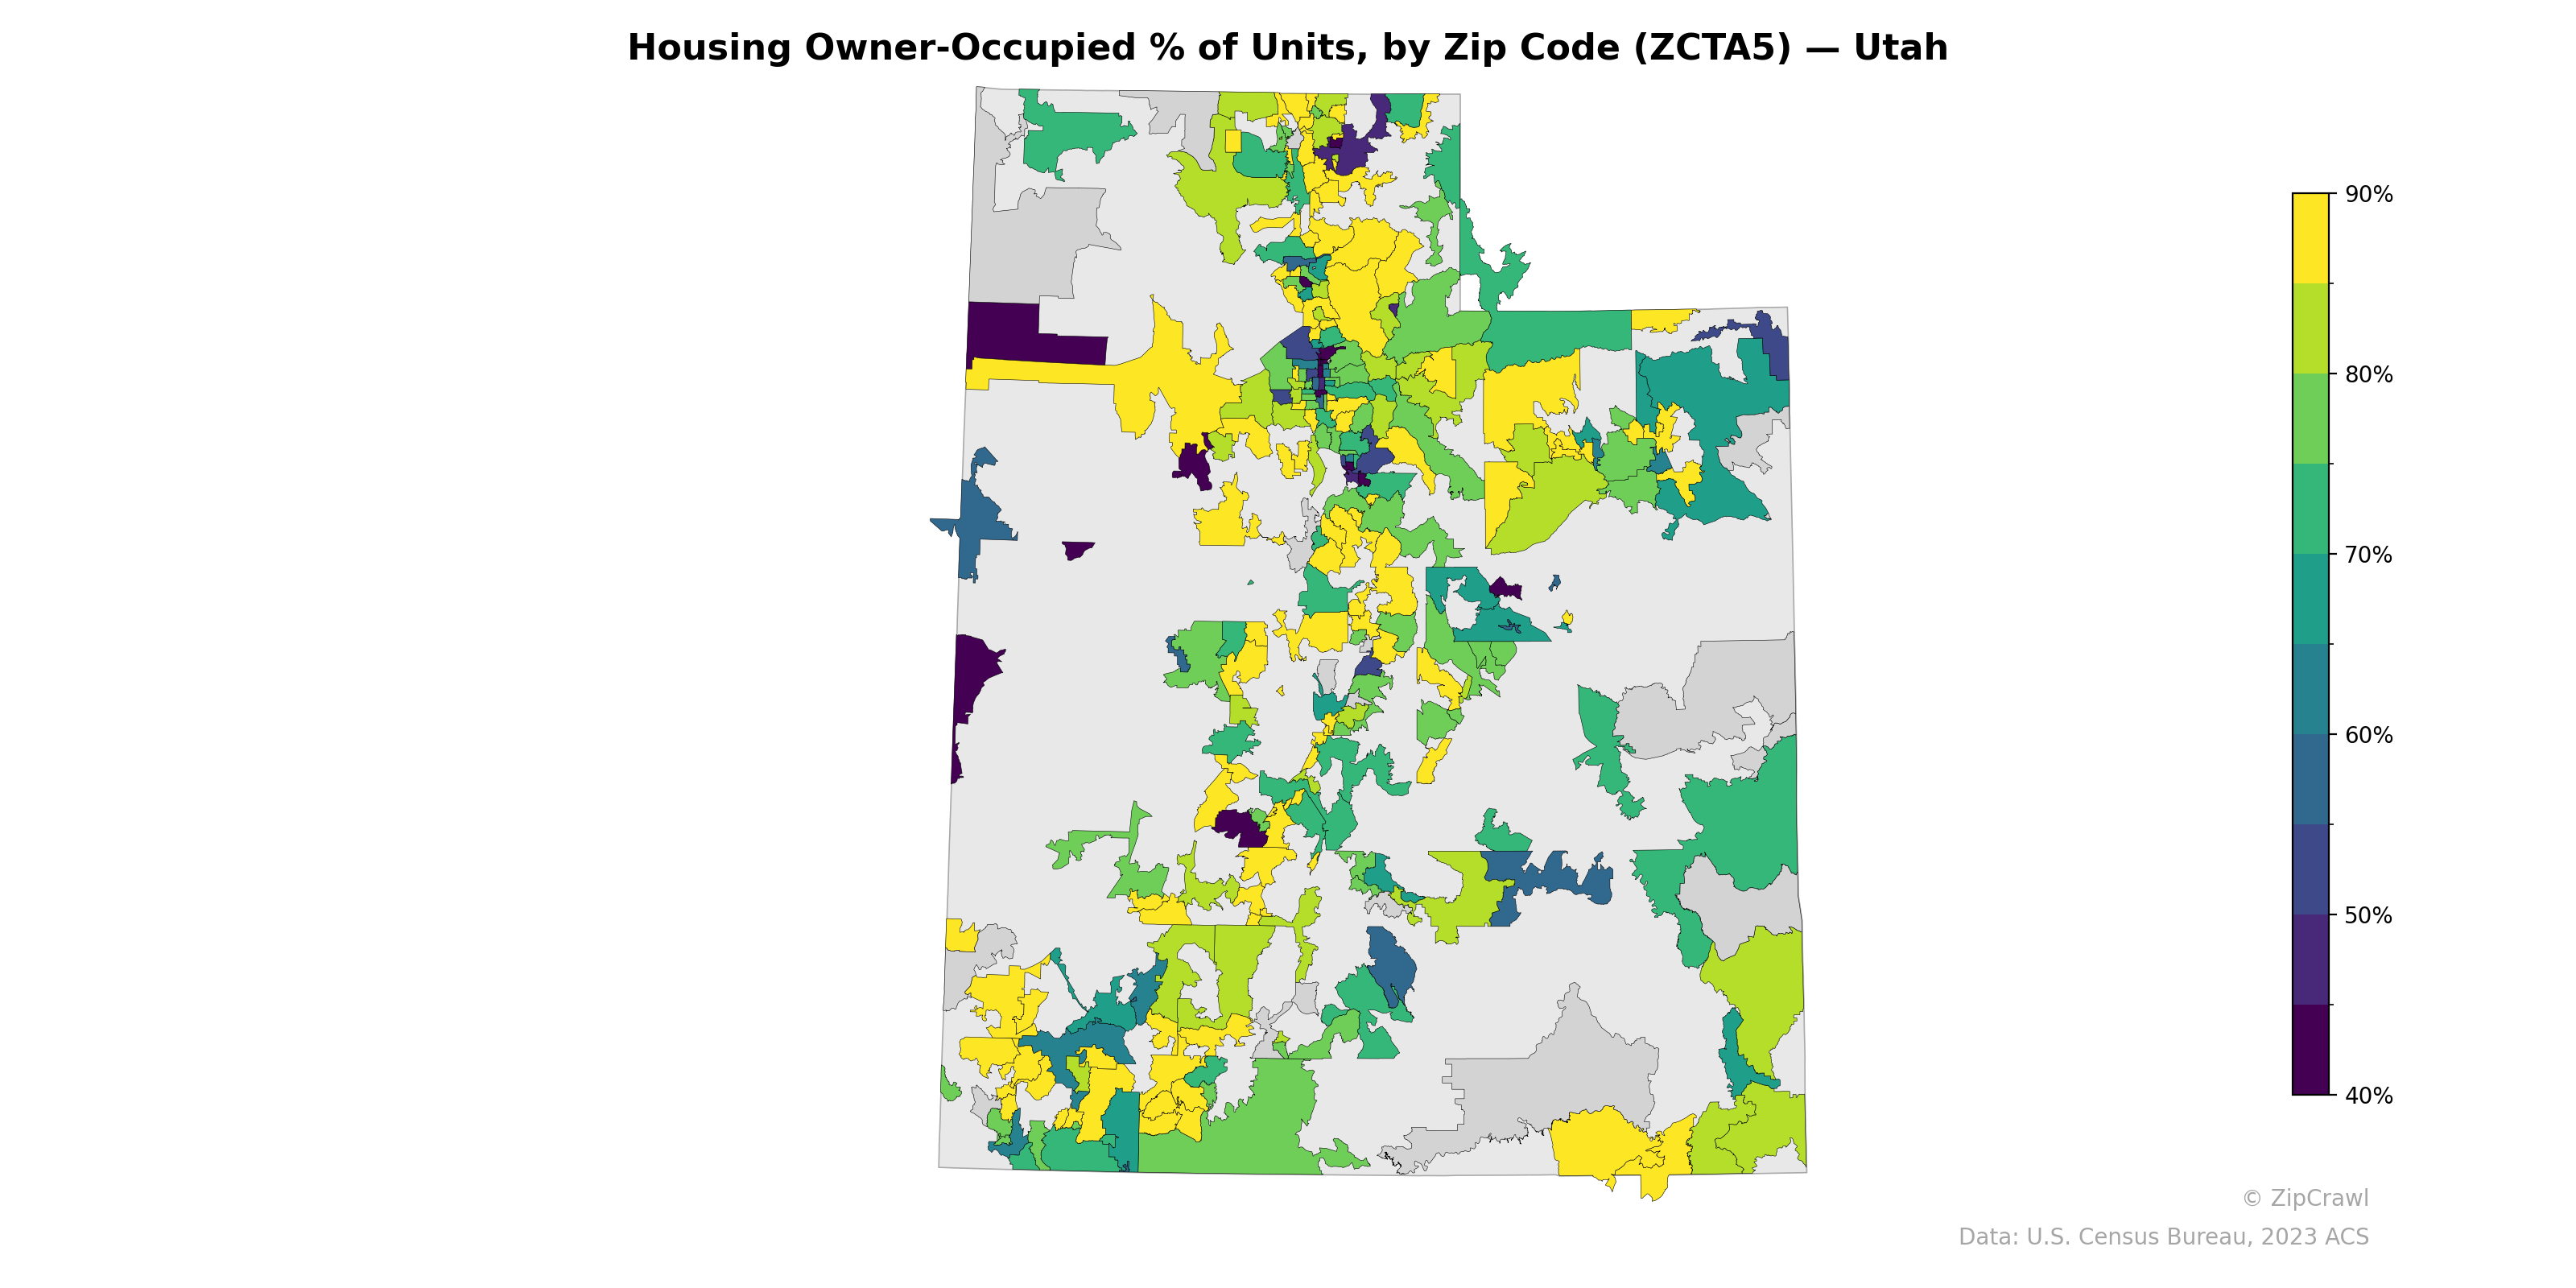
NOTE: Gray indicates insufficient data or a suppressed estimate.
Owner-occupancy rates across Utah exhibit a clear urban-suburban divide, with zip codes in the Salt Lake City core and areas around Provo and Logan displaying the lowest rates (below 50%), likely reflecting concentrations of rental housing near universities and downtown employment centers. Suburban and exurban zip codes ringing the Wasatch Front—particularly in southern Salt Lake County, Utah County's western communities, and Davis County—consistently reach 80–90% owner-occupancy, forming a yellow band of high homeownership. Rural zip codes in southwestern Utah near St. George and in the southeastern corner show notably lower owner-occupancy rates compared to other non-urban areas, suggesting pockets of seasonal, resort, or tribal housing that diverge from the statewide rural norm.
Data: U.S. Census Bureau, 2023 ACS
Explore
- Population Non-Hispanic White % by Zip Code (ZCTA5) — Florida
- U.S. Citizens (% of Population Over 18) by Zip Code (ZCTA5) — Florida
- Housing % of Units Built Since 2010, by Zip Code (ZCTA5) — Utah
- Bachelor's Degree or Higher (% of Over 25) by Zip Code (ZCTA5) — Utah
- Housing Owner-Occupied Median Value ($), by Zip Code (ZCTA5) — Utah
- Housing Median Monthly Rent ($), by Zip Code (ZCTA5) — Utah
- % of Households with Broadband Internet, by Zip Code (ZCTA5) — Utah
- % of Population without Health Insurance, by Zip Code (ZCTA5) — Utah
- Population Non-Hispanic American Indian % by Zip Code (ZCTA5) — Utah
- High School Graduate (% of Over 25) by Zip Code (ZCTA5) — Utah
- Household Average Size by Zip Code (ZCTA5) — Utah
- Housing Owner-Occupied Median Value ($), by County
- High School Graduate (% of Over 25) by Zip Code (ZCTA5) — Florida
- Population Non-Hispanic American Indian % by Zip Code (ZCTA5) — Florida
- Median Age by Zip Code (ZCTA5) — Florida
- Household Median Income by Zip Code (ZCTA5) — Florida
- Population Hispanic % by Zip Code (ZCTA5) — Florida
- Population Non-Hispanic Asian % by Zip Code (ZCTA5) — California
- % of Population on Food Stamps or SNAP (Last 12 Months), by Zip Code (ZCTA5) — California
- Population Non-Hispanic White % by Zip Code (ZCTA5) — Georgia
- Population Non-Hispanic Black % by Zip Code (ZCTA5) — Florida
- Married Couple (% of all Households) by Zip Code (ZCTA5) — Connecticut
- High School Graduate (% of Over 25) by Zip Code (ZCTA5) — Connecticut
- Housing Vacancy Rate by Zip Code (ZCTA5) — Connecticut
- Housing Median Monthly Rent ($), by Zip Code (ZCTA5) — Nevada
- Housing % of Units Built Since 2010, by Zip Code (ZCTA5) — Connecticut
- Median Age by Zip Code (ZCTA5) — Iowa
- Population Hispanic % by Zip Code (ZCTA5) — Mississippi
- Population Non-Hispanic American Indian % by Zip Code (ZCTA5) — Connecticut
- Household Median Income by Zip Code (ZCTA5) — Iowa
- Housing Owner-Occupied % of Units, by Zip Code (ZCTA5) — Ohio
- Housing Owner-Occupied % of Units, by Zip Code (ZCTA5) — Iowa
- Housing Owner-Occupied % of Units, by Zip Code (ZCTA5) — Hawaii
- Housing Owner-Occupied % of Units, by Zip Code (ZCTA5) — Wyoming
- Housing Owner-Occupied % of Units, by Zip Code (ZCTA5) — Texas
- Housing Owner-Occupied % of Units, by Zip Code (ZCTA5) — Oregon
- Housing Owner-Occupied % of Units, by Zip Code (ZCTA5) — Idaho
- Housing Owner-Occupied % of Units, by Zip Code (ZCTA5) — Maine
- Housing Owner-Occupied % of Units, by Zip Code (ZCTA5) — Nevada
- Housing Owner-Occupied % of Units, by Zip Code (ZCTA5) — Kansas