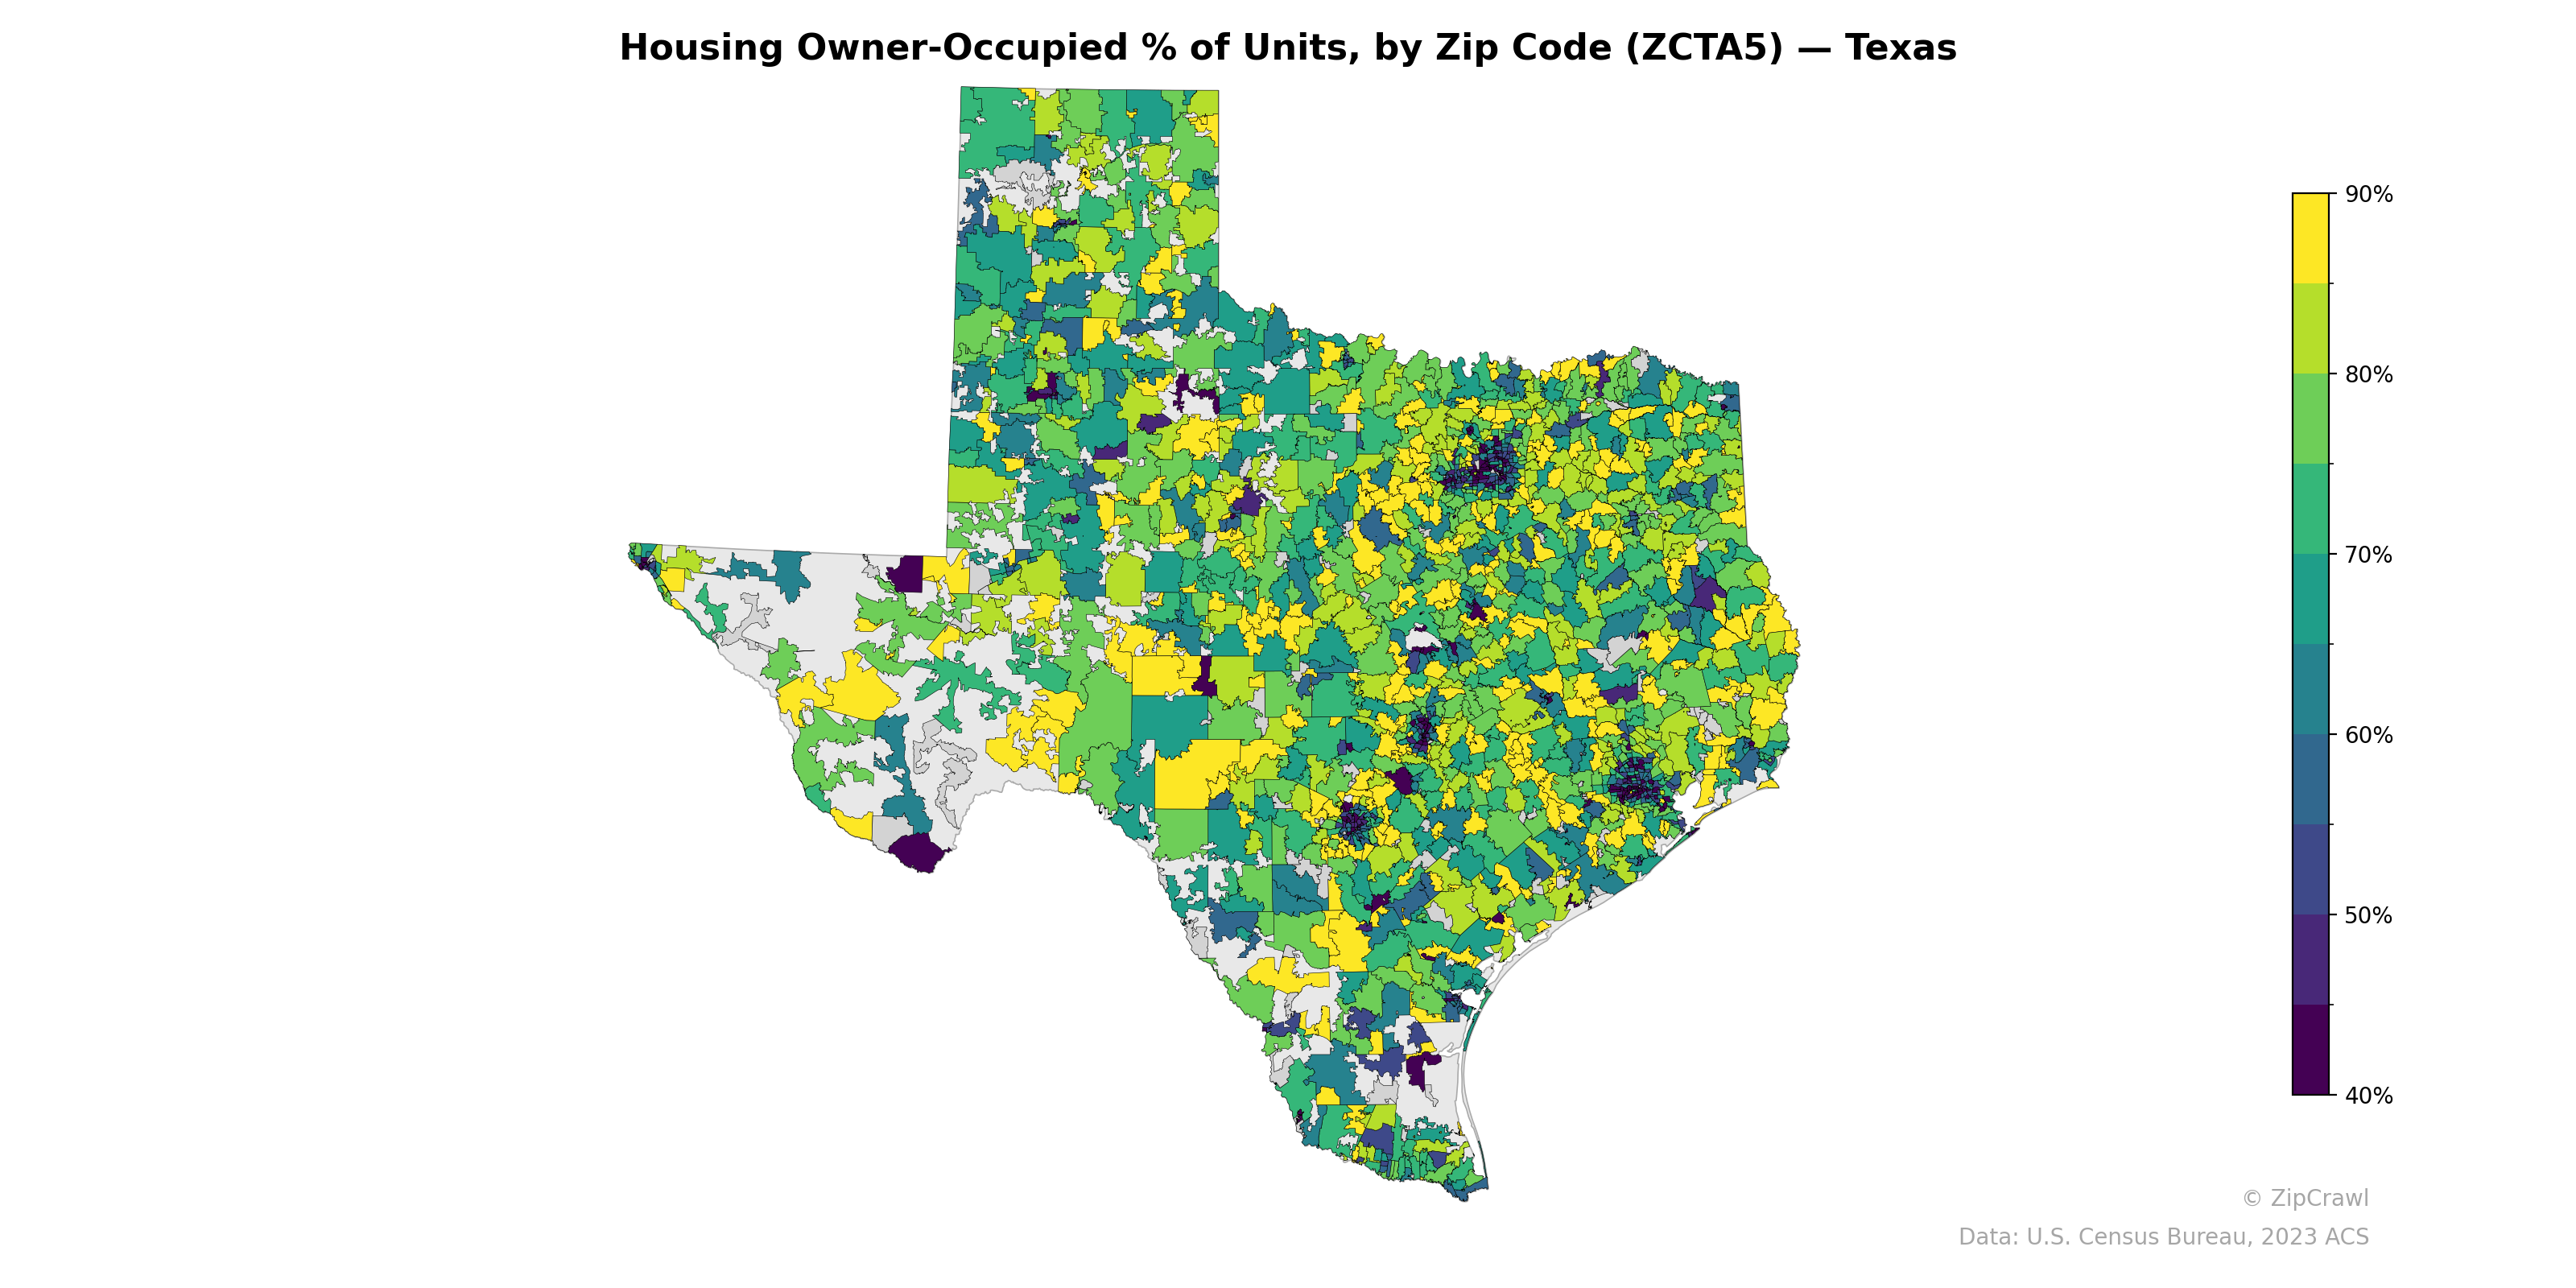
NOTE: Gray indicates insufficient data or a suppressed estimate.
Owner-occupancy rates across Texas display a clear urban-rural divide, with major metropolitan cores—particularly Dallas-Fort Worth, Houston, San Antonio, and Austin—exhibiting concentrated clusters of deep purple and dark teal zip codes below 50%, reflecting high renter populations in city centers. The rural Panhandle, West Texas, and areas between metro regions consistently register the highest owner-occupancy rates at 80–90%, appearing in bright yellow and lime green. The border region along the Rio Grande shows notably mixed patterns, with several zip codes dipping into the lower ranges alongside pockets of moderate ownership, suggesting varied housing market dynamics influenced by proximity to the border and localized economic conditions.
Data: U.S. Census Bureau, 2023 ACS
Explore
- Median Age by Zip Code (ZCTA5) — South Carolina
- % of Population on Food Stamps or SNAP (Last 12 Months), by Zip Code (ZCTA5) — Minnesota
- Population Non-Hispanic Asian % by Zip Code (ZCTA5) — Minnesota
- Housing Vacancy Rate by Zip Code (ZCTA5) — Minnesota
- Married Couple (% of all Households) by Zip Code (ZCTA5) — Minnesota
- Population Non-Hispanic White % by Zip Code (ZCTA5) — South Carolina
- U.S. Citizens (% of Population Over 18) by Zip Code (ZCTA5) — South Carolina
- Household Median Income by Zip Code (ZCTA5) — South Carolina
- Population Non-Hispanic Black % by Zip Code (ZCTA5) — South Carolina
- Population Hispanic % by Zip Code (ZCTA5) — South Carolina
- Bachelor's Degree or Higher (% of Over 25) by County
- Household Average Size by Zip Code (ZCTA5) — Texas
- Housing Owner-Occupied Median Value ($), by Zip Code (ZCTA5) — Texas
- Housing % of Units Built Since 2010, by Zip Code (ZCTA5) — Texas
- Bachelor's Degree or Higher (% of Over 25) by Zip Code (ZCTA5) — Texas
- Housing Vacancy Rate by Zip Code (ZCTA5) — Texas
- Housing Median Monthly Rent ($), by Zip Code (ZCTA5) — Texas
- % of Households with Broadband Internet, by Zip Code (ZCTA5) — Texas
- % of Population without Health Insurance, by Zip Code (ZCTA5) — Texas
- Married Couple (% of all Households) by Zip Code (ZCTA5) — Texas
- % of Population on Food Stamps or SNAP (Last 12 Months), by Zip Code (ZCTA5) — Wisconsin
- High School Graduate (% of Over 25) by Zip Code (ZCTA5) — Wisconsin
- U.S. Citizens (% of Population Over 18) by Zip Code (ZCTA5) — Colorado
- Population Non-Hispanic American Indian % by Zip Code (ZCTA5) — Wisconsin
- Population Non-Hispanic Black % by Zip Code (ZCTA5) — Wisconsin
- Population Non-Hispanic White % by Zip Code (ZCTA5) — Wisconsin
- Household Median Income by Zip Code (ZCTA5) — Colorado
- Bachelor's Degree or Higher (% of Over 25) by Zip Code (ZCTA5) — Wisconsin
- Married Couple (% of all Households) by Zip Code (ZCTA5) — Wisconsin
- Median Age by Zip Code (ZCTA5) — Wisconsin
- Housing Owner-Occupied % of Units, by Zip Code (ZCTA5) — Ohio
- Housing Owner-Occupied % of Units, by Zip Code (ZCTA5) — Utah
- Housing Owner-Occupied % of Units, by Zip Code (ZCTA5) — Kansas
- Housing Owner-Occupied % of Units, by Zip Code (ZCTA5) — Iowa
- Housing Owner-Occupied % of Units, by Zip Code (ZCTA5) — Tennessee
- Housing Owner-Occupied % of Units, by Zip Code (ZCTA5) — Oregon
- Housing Owner-Occupied % of Units, by Zip Code (ZCTA5) — Hawaii
- Housing Owner-Occupied % of Units, by Zip Code (ZCTA5) — Idaho
- Housing Owner-Occupied % of Units, by Zip Code (ZCTA5) — Maine
- Housing Owner-Occupied % of Units, by Zip Code (ZCTA5) — Wyoming