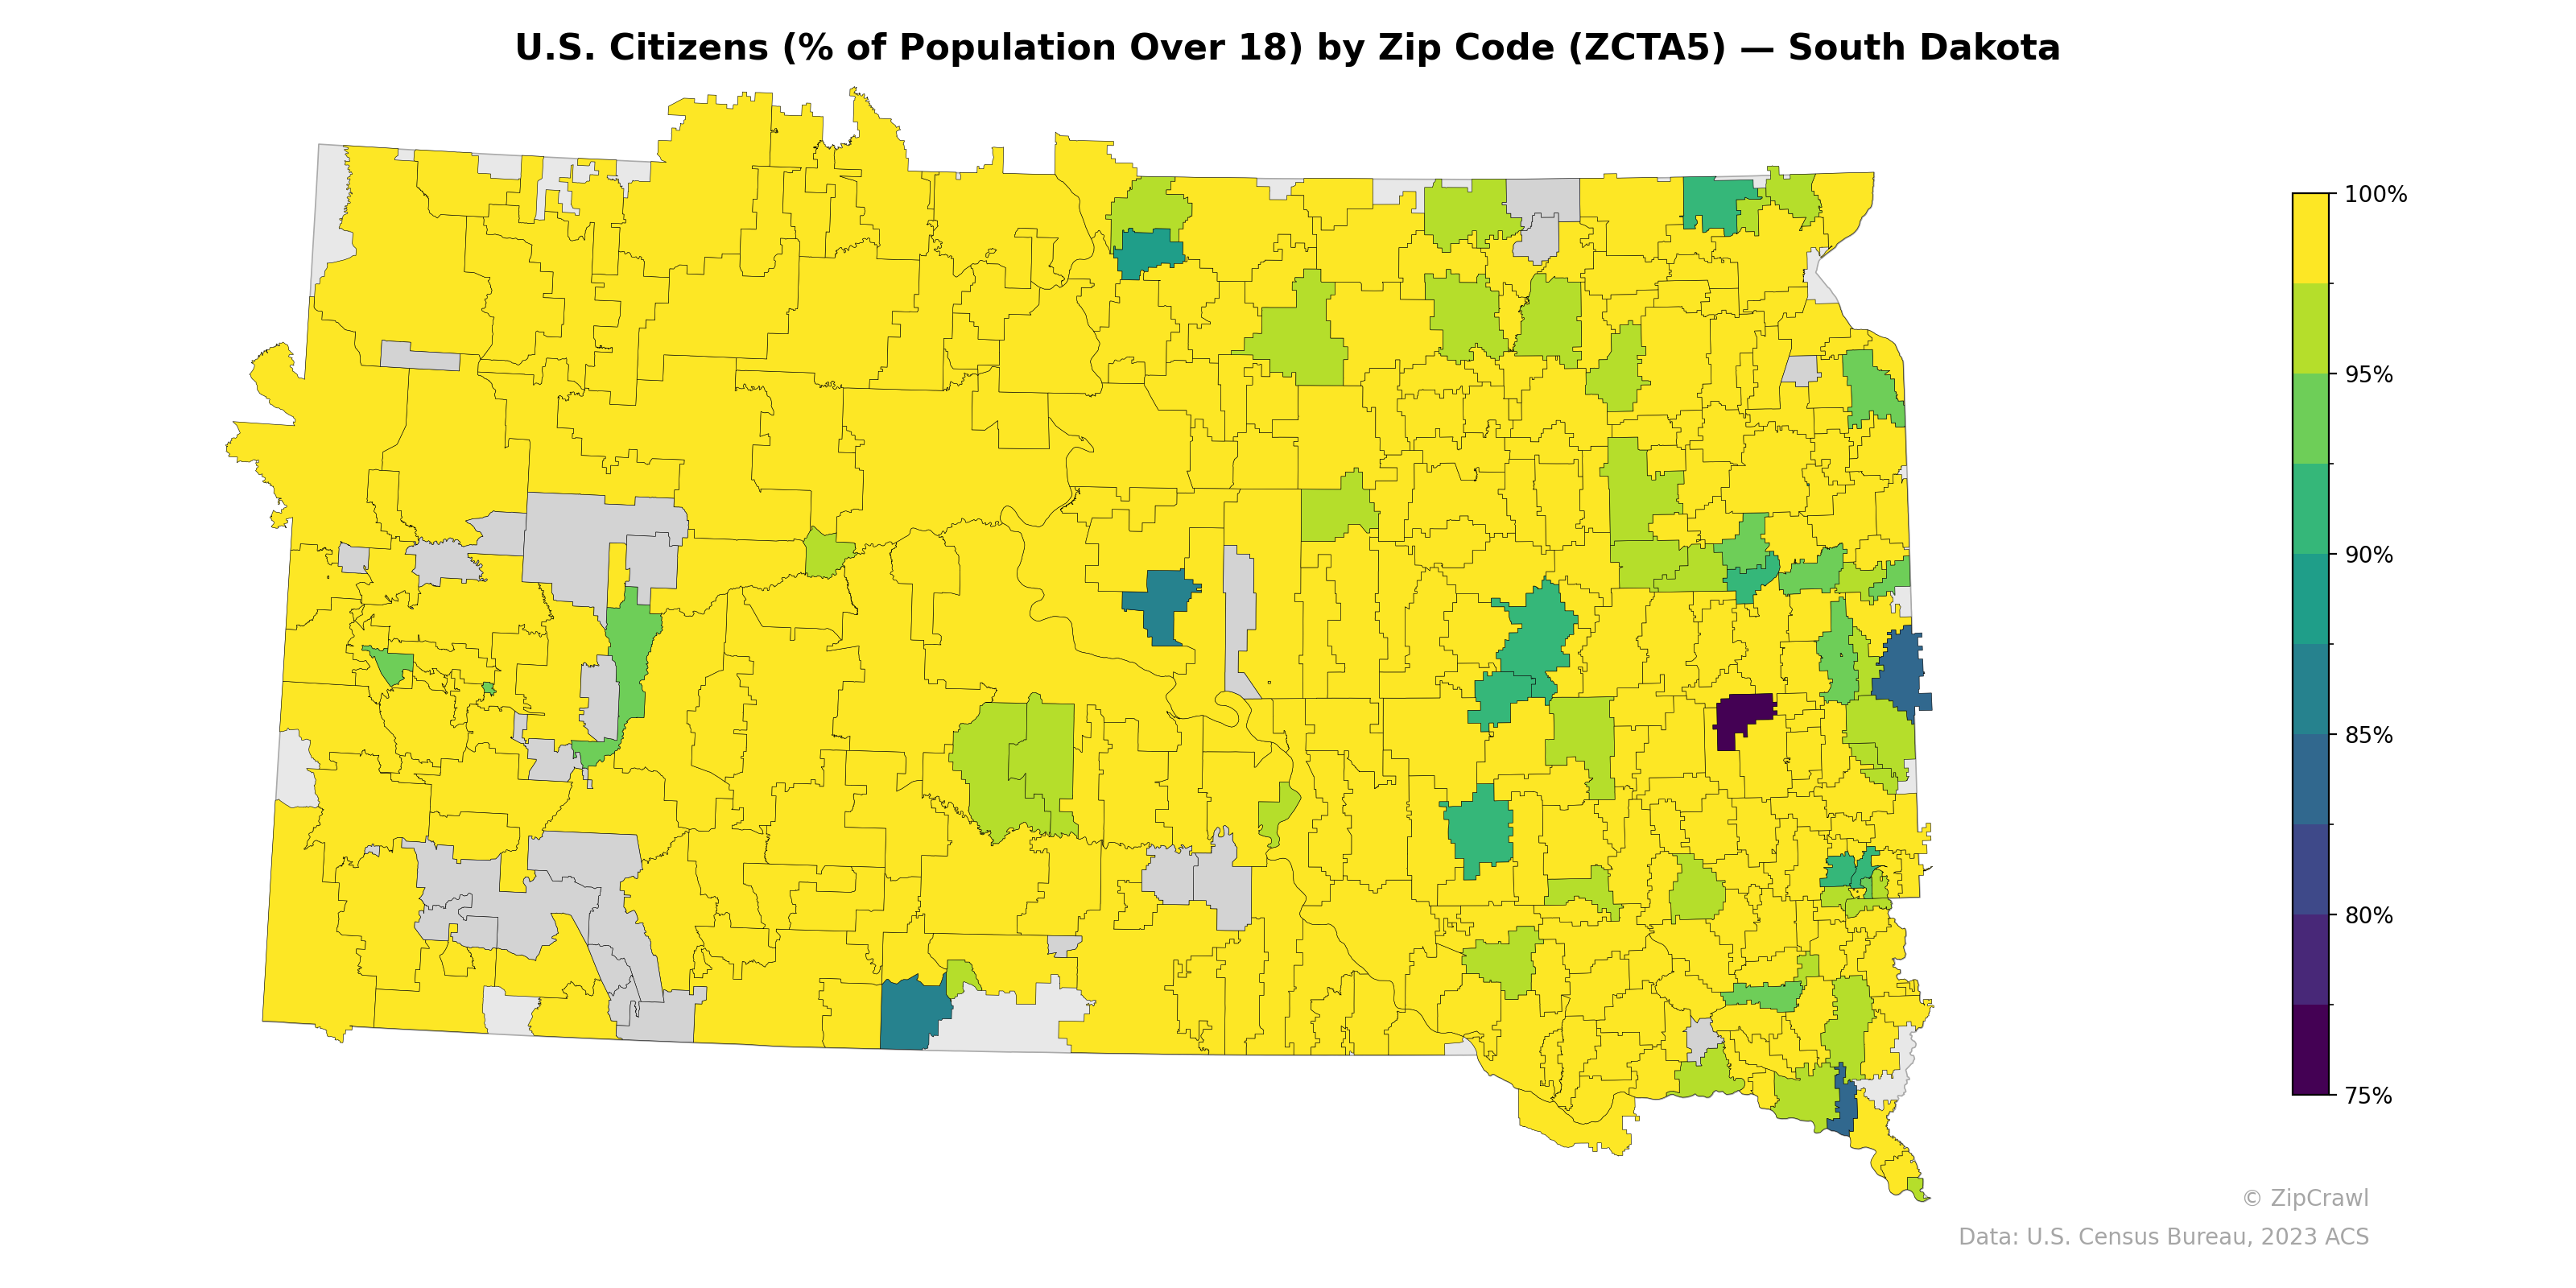
NOTE: Gray indicates insufficient data or a suppressed estimate.
The vast majority of South Dakota zip codes report U.S. citizenship rates above 95% among adults, with near-universal citizenship across the rural western and central portions of the state. Notable exceptions cluster in the eastern part of the state, particularly around the Sioux Falls metro area and a few southeastern zip codes near the Yankton area, where rates dip to 75–85%, likely reflecting immigrant and refugee resettlement communities. Several scattered zip codes in the central region, including what appears to be the Huron area, also show moderately lower citizenship rates in the 85–90% range, consistent with meatpacking industry employment centers that attract foreign-born workers.
Data: U.S. Census Bureau, 2023 ACS
Explore
- Housing Owner-Occupied % of Units, by Zip Code (ZCTA5) — New York
- Population Hispanic % by Zip Code (ZCTA5) — South Dakota
- Population Non-Hispanic White % by Zip Code (ZCTA5) — South Dakota
- % of Population on Food Stamps or SNAP (Last 12 Months), by Zip Code (ZCTA5) — Delaware
- Population Non-Hispanic Black % by Zip Code (ZCTA5) — South Dakota
- Married Couple (% of all Households) by Zip Code (ZCTA5) — Delaware
- Median Age by Zip Code (ZCTA5) — South Dakota
- Housing Vacancy Rate by Zip Code (ZCTA5) — Delaware
- Population Non-Hispanic Asian % by Zip Code (ZCTA5) — Delaware
- Household Median Income by Zip Code (ZCTA5) — South Dakota
- Household Average Size by County
- Married Couple (% of all Households) by Zip Code (ZCTA5) — New York
- Housing Owner-Occupied Median Value ($), by Zip Code (ZCTA5) — Massachusetts
- Housing % of Units Built Since 2010, by Zip Code (ZCTA5) — New York
- Household Average Size by Zip Code (ZCTA5) — New York
- % of Population without Health Insurance, by Zip Code (ZCTA5) — New York
- Housing Owner-Occupied Median Value ($), by Zip Code (ZCTA5) — New York
- % of Households with Broadband Internet, by Zip Code (ZCTA5) — New York
- Housing Vacancy Rate by Zip Code (ZCTA5) — New York
- Housing Owner-Occupied Median Value ($), by Zip Code (ZCTA5) — Florida
- Bachelor's Degree or Higher (% of Over 25) by Zip Code (ZCTA5) — New York
- Housing Median Monthly Rent ($), by Zip Code (ZCTA5) — New York
- High School Graduate (% of Over 25) by Zip Code (ZCTA5) — Rhode Island
- Population Non-Hispanic American Indian % by Zip Code (ZCTA5) — North Dakota
- Married Couple (% of all Households) by Zip Code (ZCTA5) — Rhode Island
- Bachelor's Degree or Higher (% of Over 25) by Zip Code (ZCTA5) — Rhode Island
- Population Non-Hispanic Black % by Zip Code (ZCTA5) — North Dakota
- Housing Vacancy Rate by Zip Code (ZCTA5) — Alaska
- Population Non-Hispanic American Indian % by Zip Code (ZCTA5) — Rhode Island
- Household Average Size by Zip Code (ZCTA5) — Rhode Island
- U.S. Citizens (% of Population Over 18) by Zip Code (ZCTA5) — North Dakota
- U.S. Citizens (% of Population Over 18) by Zip Code (ZCTA5) — South Carolina
- U.S. Citizens (% of Population Over 18) by Zip Code (ZCTA5) — Ohio
- U.S. Citizens (% of Population Over 18) by Zip Code (ZCTA5) — Utah
- U.S. Citizens (% of Population Over 18) by Zip Code (ZCTA5) — Iowa
- U.S. Citizens (% of Population Over 18) by Zip Code (ZCTA5) — Oregon
- U.S. Citizens (% of Population Over 18) by Zip Code (ZCTA5) — Minnesota
- U.S. Citizens (% of Population Over 18) by Zip Code (ZCTA5) — Texas
- U.S. Citizens (% of Population Over 18) by Zip Code (ZCTA5) — Idaho
- U.S. Citizens (% of Population Over 18) by Zip Code (ZCTA5) — Maine