NOTE: Gray indicates insufficient data or a suppressed estimate.
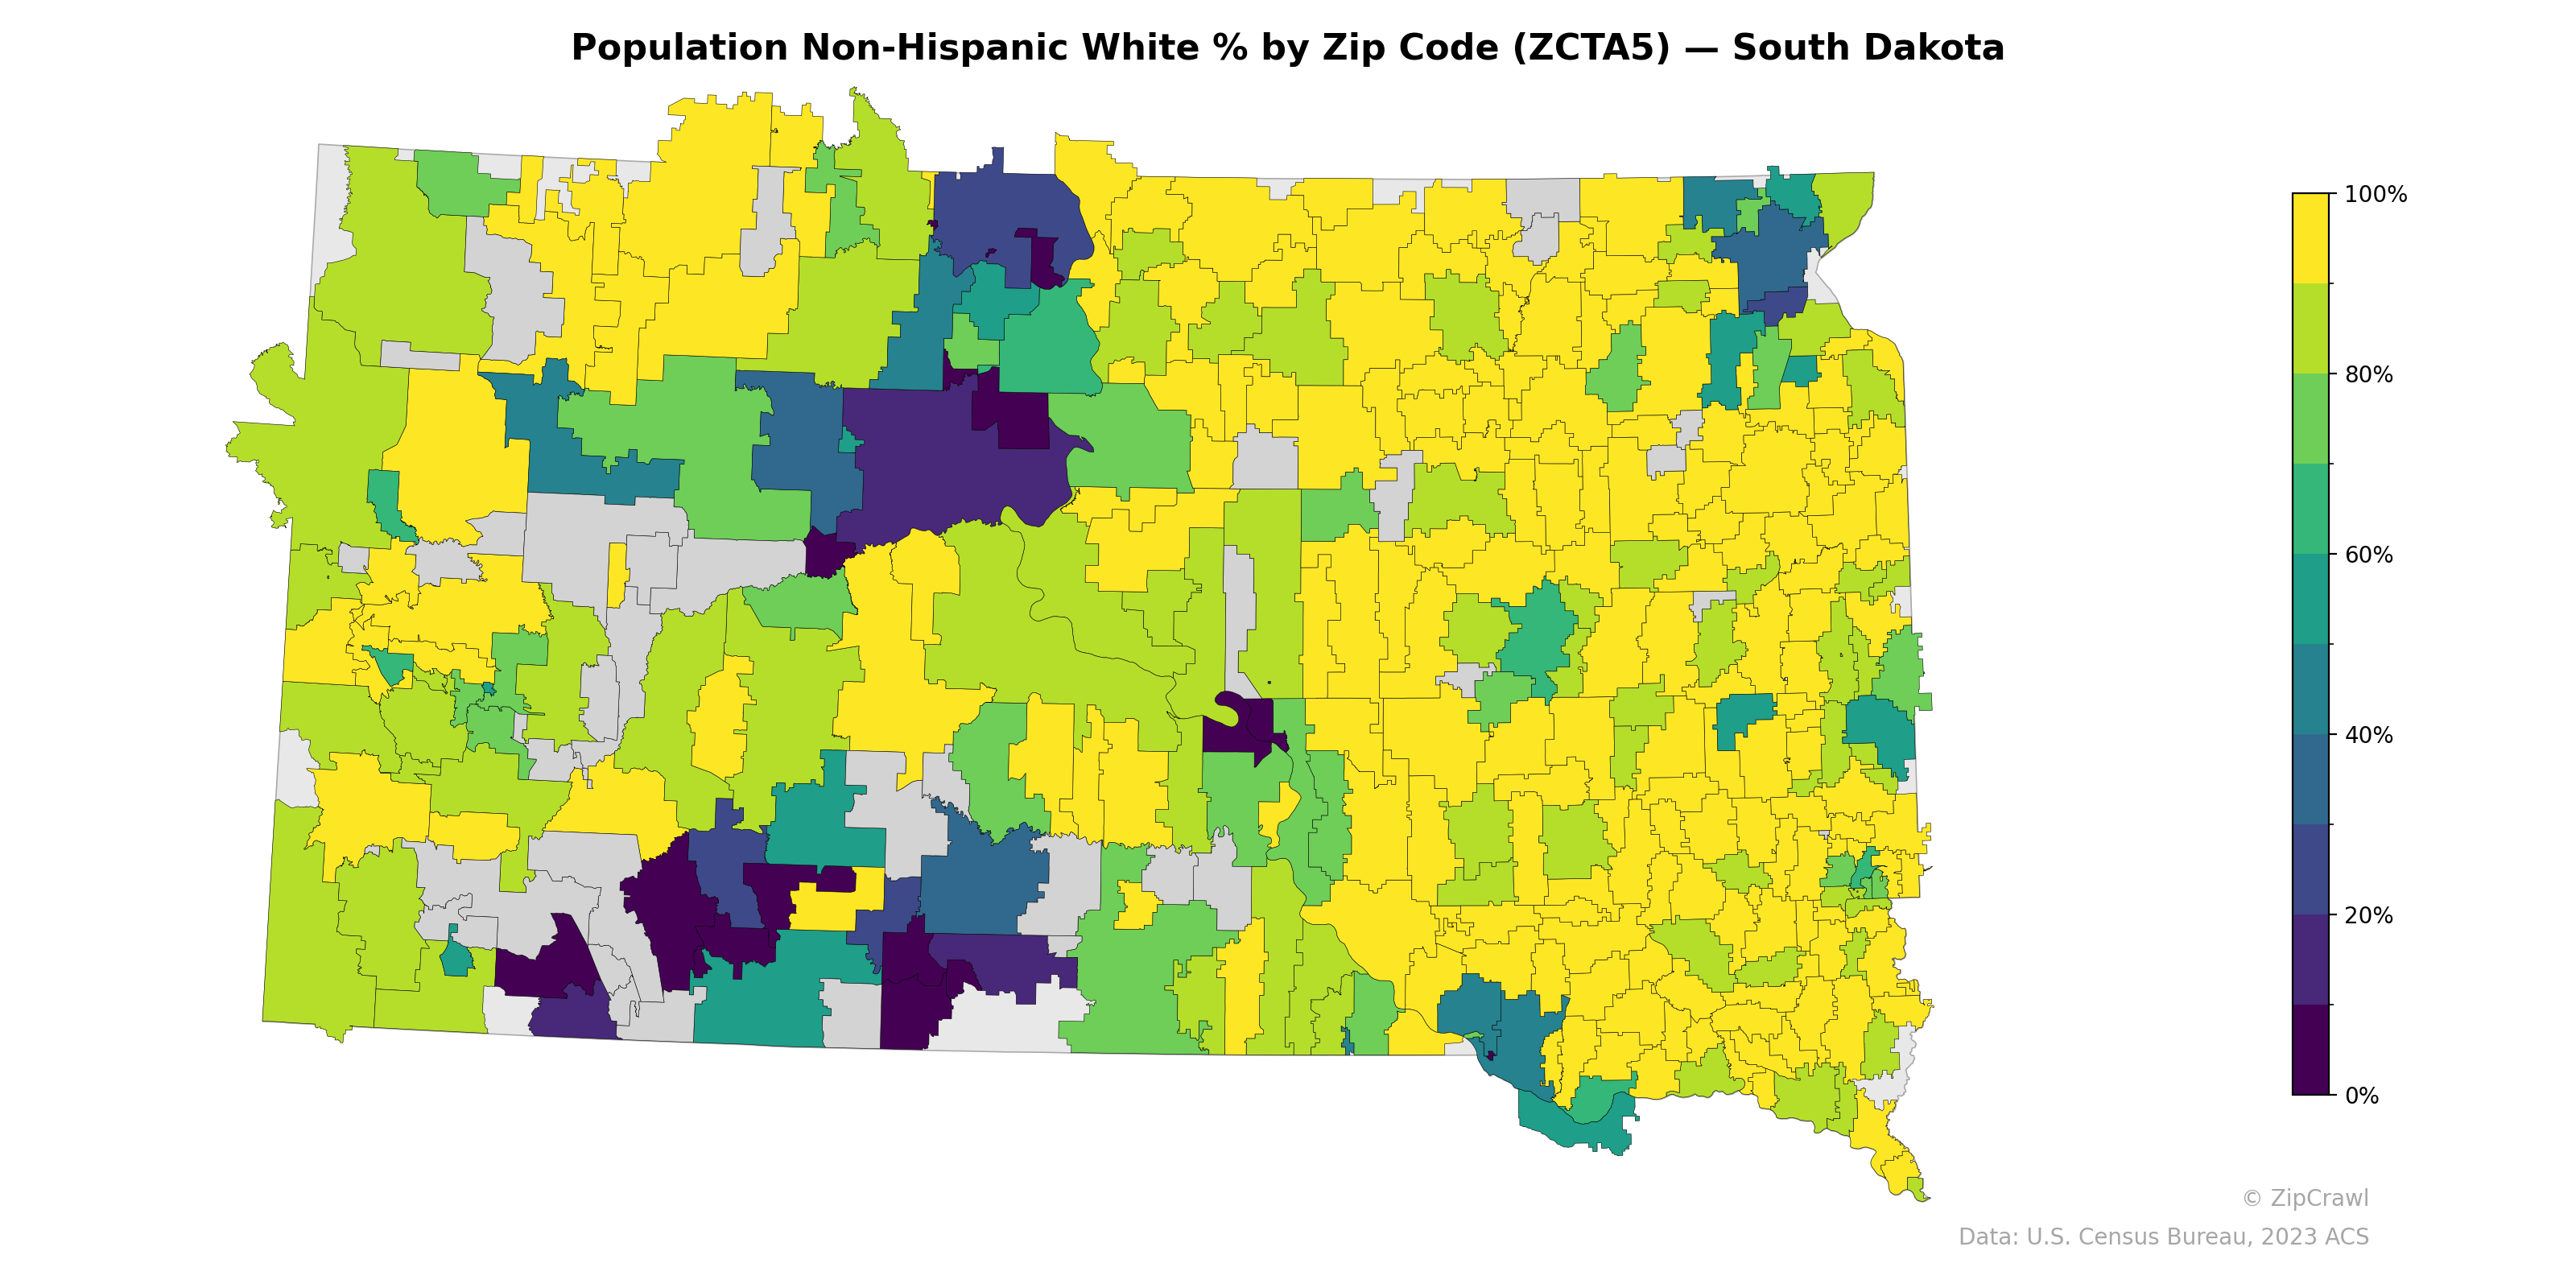
The western half of South Dakota displays significantly lower non-Hispanic white percentages, particularly in zip codes overlapping the Pine Ridge, Rosebud, Cheyenne River, and Standing Rock reservations, where values drop below 20%. The eastern third of the state is predominantly yellow, indicating non-Hispanic white populations consistently above 90%, with notable exceptions around the Sioux Falls and Yankton areas where greater demographic diversity appears. A sharp demographic boundary runs roughly along the Missouri River corridor, separating the more homogeneous eastern region from the west's patchwork of reservation and non-reservation zip codes.
Data: U.S. Census Bureau, 2023 ACS
Explore
- Housing Owner-Occupied % of Units, by Zip Code (ZCTA5) — New York
- Population Non-Hispanic Black % by Zip Code (ZCTA5) — South Dakota
- Median Age by Zip Code (ZCTA5) — South Dakota
- Population Non-Hispanic Asian % by Zip Code (ZCTA5) — Delaware
- % of Population on Food Stamps or SNAP (Last 12 Months), by Zip Code (ZCTA5) — Delaware
- Population Hispanic % by Zip Code (ZCTA5) — South Dakota
- Married Couple (% of all Households) by Zip Code (ZCTA5) — Delaware
- U.S. Citizens (% of Population Over 18) by Zip Code (ZCTA5) — South Dakota
- Household Median Income by Zip Code (ZCTA5) — South Dakota
- Housing Vacancy Rate by Zip Code (ZCTA5) — Delaware
- Household Average Size by County
- Housing % of Units Built Since 2010, by Zip Code (ZCTA5) — New York
- Married Couple (% of all Households) by Zip Code (ZCTA5) — New York
- Household Average Size by Zip Code (ZCTA5) — New York
- Household Average Size by Zip Code (ZCTA5) — Massachusetts
- % of Population without Health Insurance, by Zip Code (ZCTA5) — New York
- % of Households with Broadband Internet, by Zip Code (ZCTA5) — New York
- Housing Owner-Occupied Median Value ($), by Zip Code (ZCTA5) — New York
- Housing Vacancy Rate by Zip Code (ZCTA5) — New York
- Bachelor's Degree or Higher (% of Over 25) by Zip Code (ZCTA5) — New York
- Household Average Size by Zip Code (ZCTA5) — Florida
- Housing Median Monthly Rent ($), by Zip Code (ZCTA5) — New York
- Population Non-Hispanic American Indian % by Zip Code (ZCTA5) — Rhode Island
- Housing Vacancy Rate by Zip Code (ZCTA5) — Alaska
- Married Couple (% of all Households) by Zip Code (ZCTA5) — Rhode Island
- High School Graduate (% of Over 25) by Zip Code (ZCTA5) — Rhode Island
- Housing % of Units Built Since 2010, by Zip Code (ZCTA5) — Rhode Island
- Population Non-Hispanic Black % by Zip Code (ZCTA5) — North Dakota
- Population Non-Hispanic American Indian % by Zip Code (ZCTA5) — North Dakota
- Household Average Size by Zip Code (ZCTA5) — Rhode Island
- Population Non-Hispanic White % by Zip Code (ZCTA5) — North Dakota
- Population Non-Hispanic White % by Zip Code (ZCTA5) — South Carolina
- Population Non-Hispanic White % by Zip Code (ZCTA5) — Ohio
- Population Non-Hispanic White % by Zip Code (ZCTA5) — Utah
- Population Non-Hispanic White % by Zip Code (ZCTA5) — Iowa
- Population Non-Hispanic White % by Zip Code (ZCTA5) — Minnesota
- Population Non-Hispanic White % by Zip Code (ZCTA5) — Oregon
- Population Non-Hispanic White % by Zip Code (ZCTA5) — Texas
- Population Non-Hispanic White % by Zip Code (ZCTA5) — Nevada
- Population Non-Hispanic White % by Zip Code (ZCTA5) — Idaho