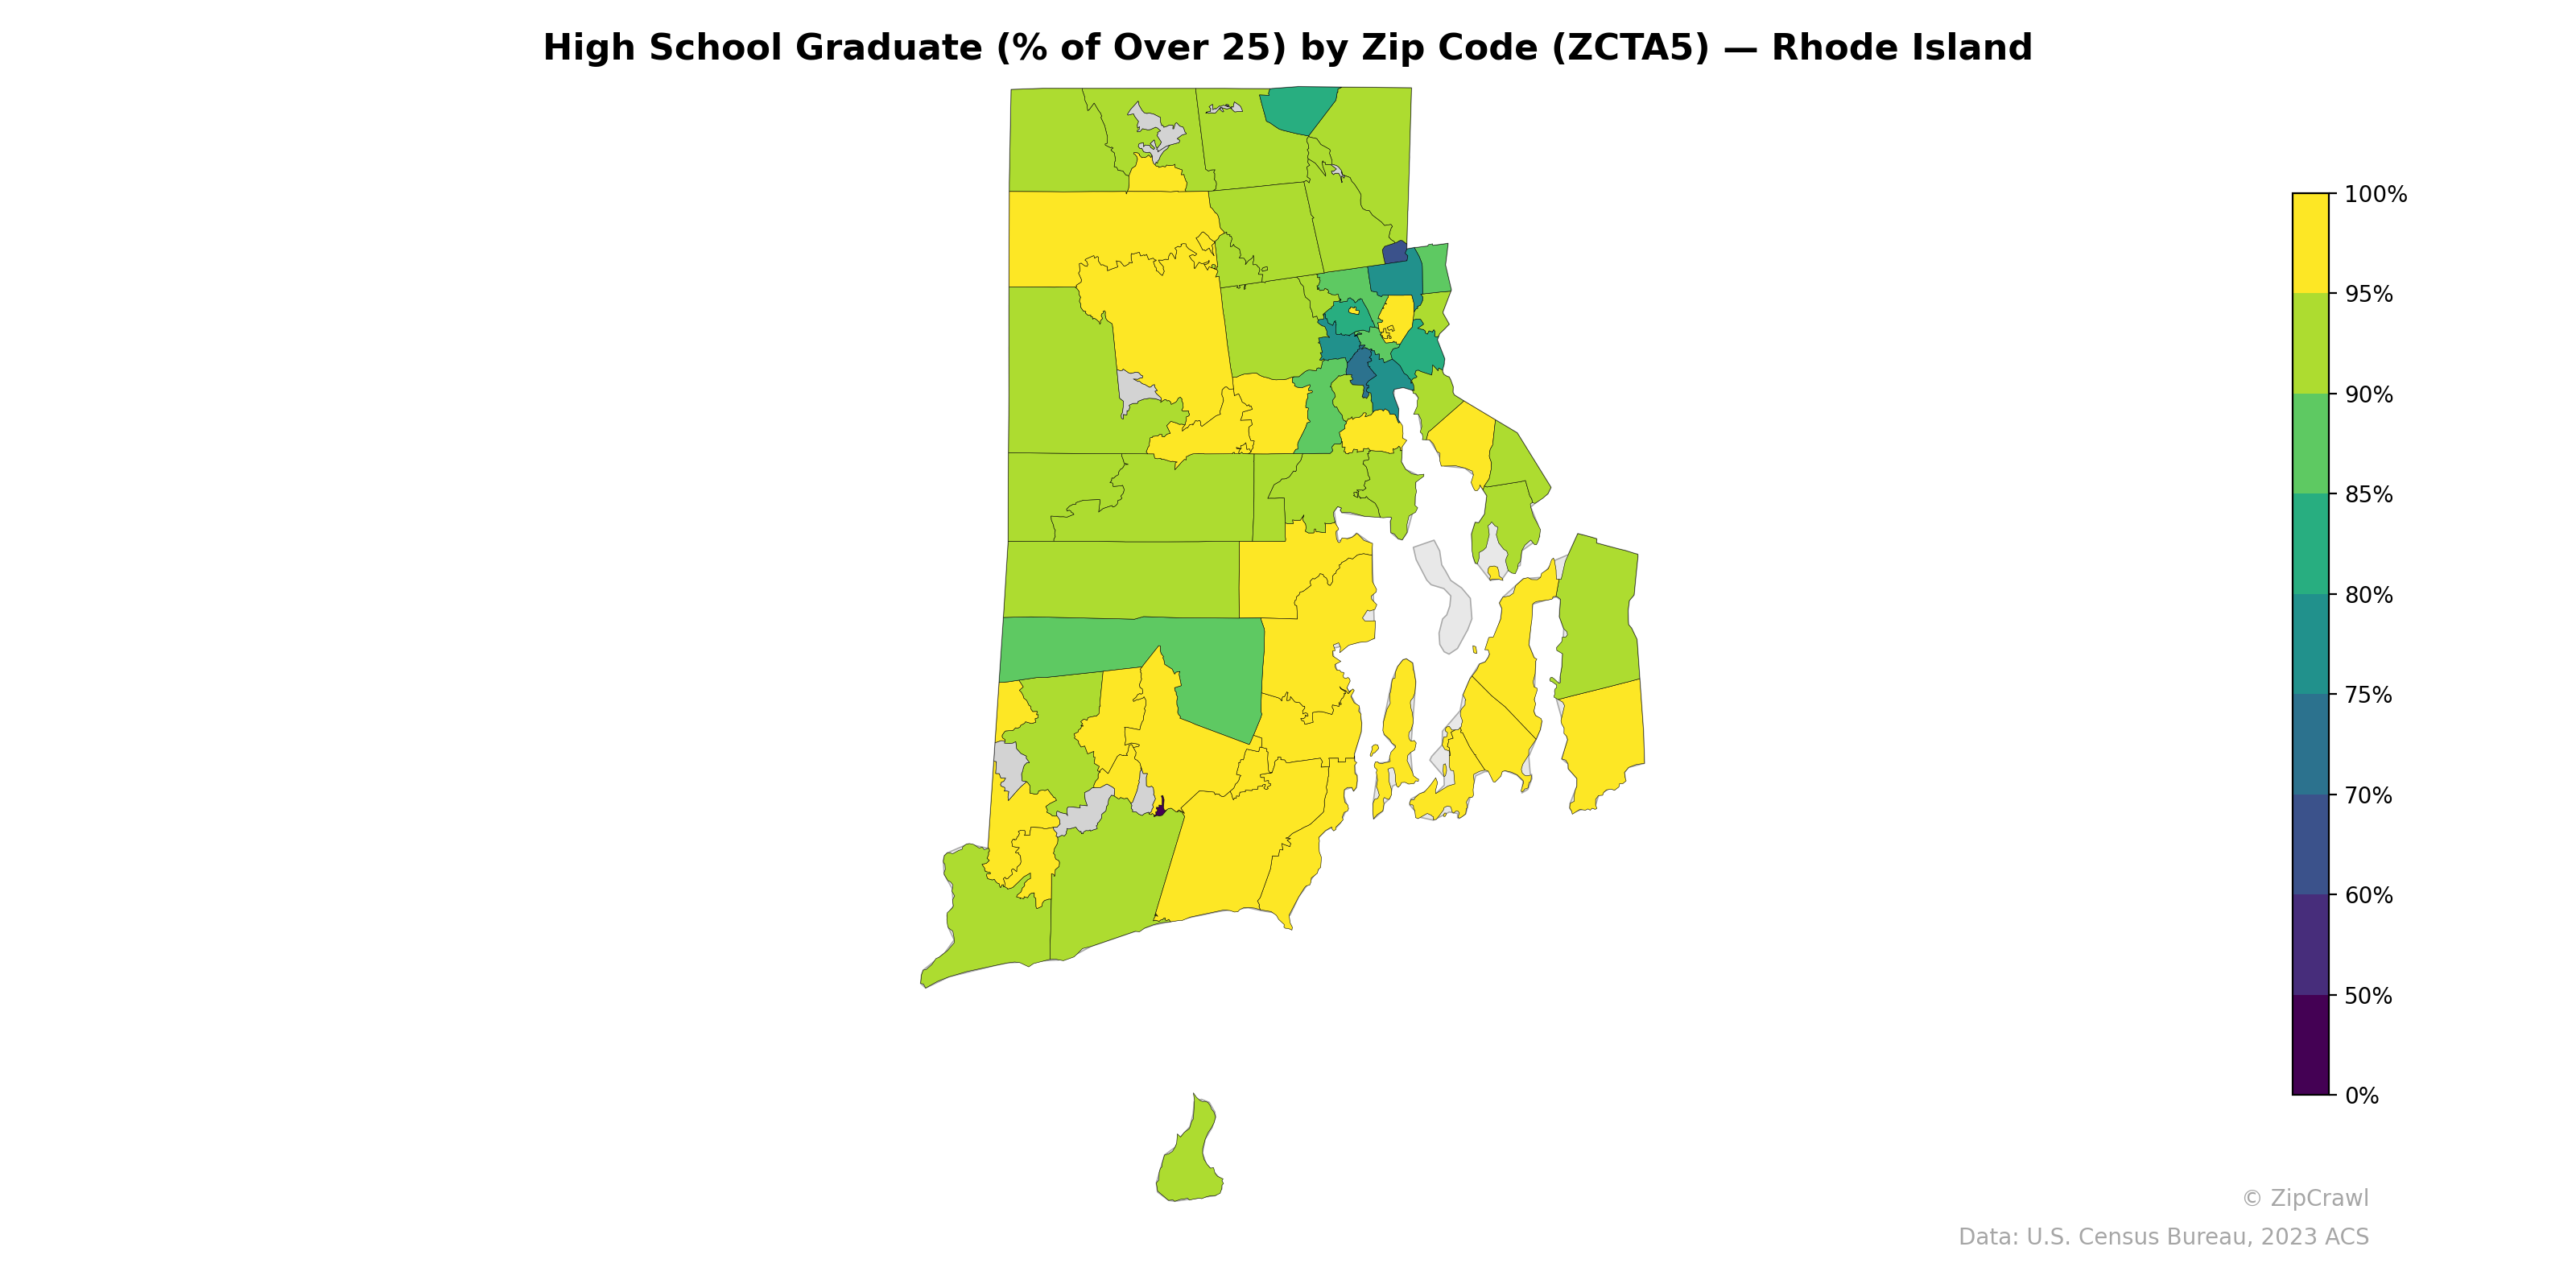
NOTE: Gray indicates insufficient data or a suppressed estimate.
High school graduation rates across Rhode Island zip codes generally range from the mid-80s to near 100%, with the lowest rates concentrated in the Providence metro area, where several urban core zip codes dip into the 60–75% range, appearing in teal and darker green tones. Suburban and rural zip codes in the western and southern portions of the state consistently display yellow hues indicating graduation rates above 90%, with many approaching or exceeding 95%. The sharpest geographic contrast occurs between central Providence and its immediately surrounding suburbs, where rates can jump 15–20 percentage points across adjacent zip code boundaries.
Data: U.S. Census Bureau, 2023 ACS
Explore
- Bachelor's Degree or Higher (% of Over 25) by Zip Code (ZCTA5) — New York
- Bachelor's Degree or Higher (% of Over 25) by Zip Code (ZCTA5) — Rhode Island
- Population Non-Hispanic American Indian % by Zip Code (ZCTA5) — Rhode Island
- Housing Owner-Occupied % of Units, by Zip Code (ZCTA5) — Rhode Island
- Household Average Size by Zip Code (ZCTA5) — Rhode Island
- % of Households with Broadband Internet, by Zip Code (ZCTA5) — Rhode Island
- Housing Owner-Occupied Median Value ($), by Zip Code (ZCTA5) — Rhode Island
- Housing Median Monthly Rent ($), by Zip Code (ZCTA5) — Rhode Island
- Housing % of Units Built Since 2010, by Zip Code (ZCTA5) — Rhode Island
- % of Population without Health Insurance, by Zip Code (ZCTA5) — Rhode Island
- Household Average Size by County
- Housing % of Units Built Since 2010, by Zip Code (ZCTA5) — New York
- % of Population on Food Stamps or SNAP (Last 12 Months), by Zip Code (ZCTA5) — Arizona
- Household Average Size by Zip Code (ZCTA5) — New York
- Married Couple (% of all Households) by Zip Code (ZCTA5) — New York
- Housing Owner-Occupied % of Units, by Zip Code (ZCTA5) — New York
- % of Households with Broadband Internet, by Zip Code (ZCTA5) — New York
- Housing Owner-Occupied Median Value ($), by Zip Code (ZCTA5) — New York
- % of Population on Food Stamps or SNAP (Last 12 Months), by Zip Code (ZCTA5) — Texas
- Housing Vacancy Rate by Zip Code (ZCTA5) — New York
- Housing Median Monthly Rent ($), by Zip Code (ZCTA5) — New York
- % of Population without Health Insurance, by Zip Code (ZCTA5) — New York
- Population Non-Hispanic American Indian % by Zip Code (ZCTA5) — North Dakota
- Housing Vacancy Rate by Zip Code (ZCTA5) — Rhode Island
- Population Non-Hispanic Black % by Zip Code (ZCTA5) — North Dakota
- Married Couple (% of all Households) by Zip Code (ZCTA5) — Rhode Island
- Population Non-Hispanic Asian % by Zip Code (ZCTA5) — Rhode Island
- Housing Vacancy Rate by Zip Code (ZCTA5) — Alaska
- % of Population on Food Stamps or SNAP (Last 12 Months), by Zip Code (ZCTA5) — Rhode Island
- U.S. Citizens (% of Population Over 18) by Zip Code (ZCTA5) — Delaware
- High School Graduate (% of Over 25) by Zip Code (ZCTA5) — Maryland
- High School Graduate (% of Over 25) by Zip Code (ZCTA5) — Iowa
- High School Graduate (% of Over 25) by Zip Code (ZCTA5) — Idaho
- High School Graduate (% of Over 25) by Zip Code (ZCTA5) — Ohio
- High School Graduate (% of Over 25) by Zip Code (ZCTA5) — Utah
- High School Graduate (% of Over 25) by Zip Code (ZCTA5) — Indiana
- High School Graduate (% of Over 25) by Zip Code (ZCTA5) — Colorado
- High School Graduate (% of Over 25) by Zip Code (ZCTA5) — Texas
- High School Graduate (% of Over 25) by Zip Code (ZCTA5) — Oregon
- High School Graduate (% of Over 25) by Zip Code (ZCTA5) — Hawaii