NOTE: Gray indicates insufficient data or a suppressed estimate.
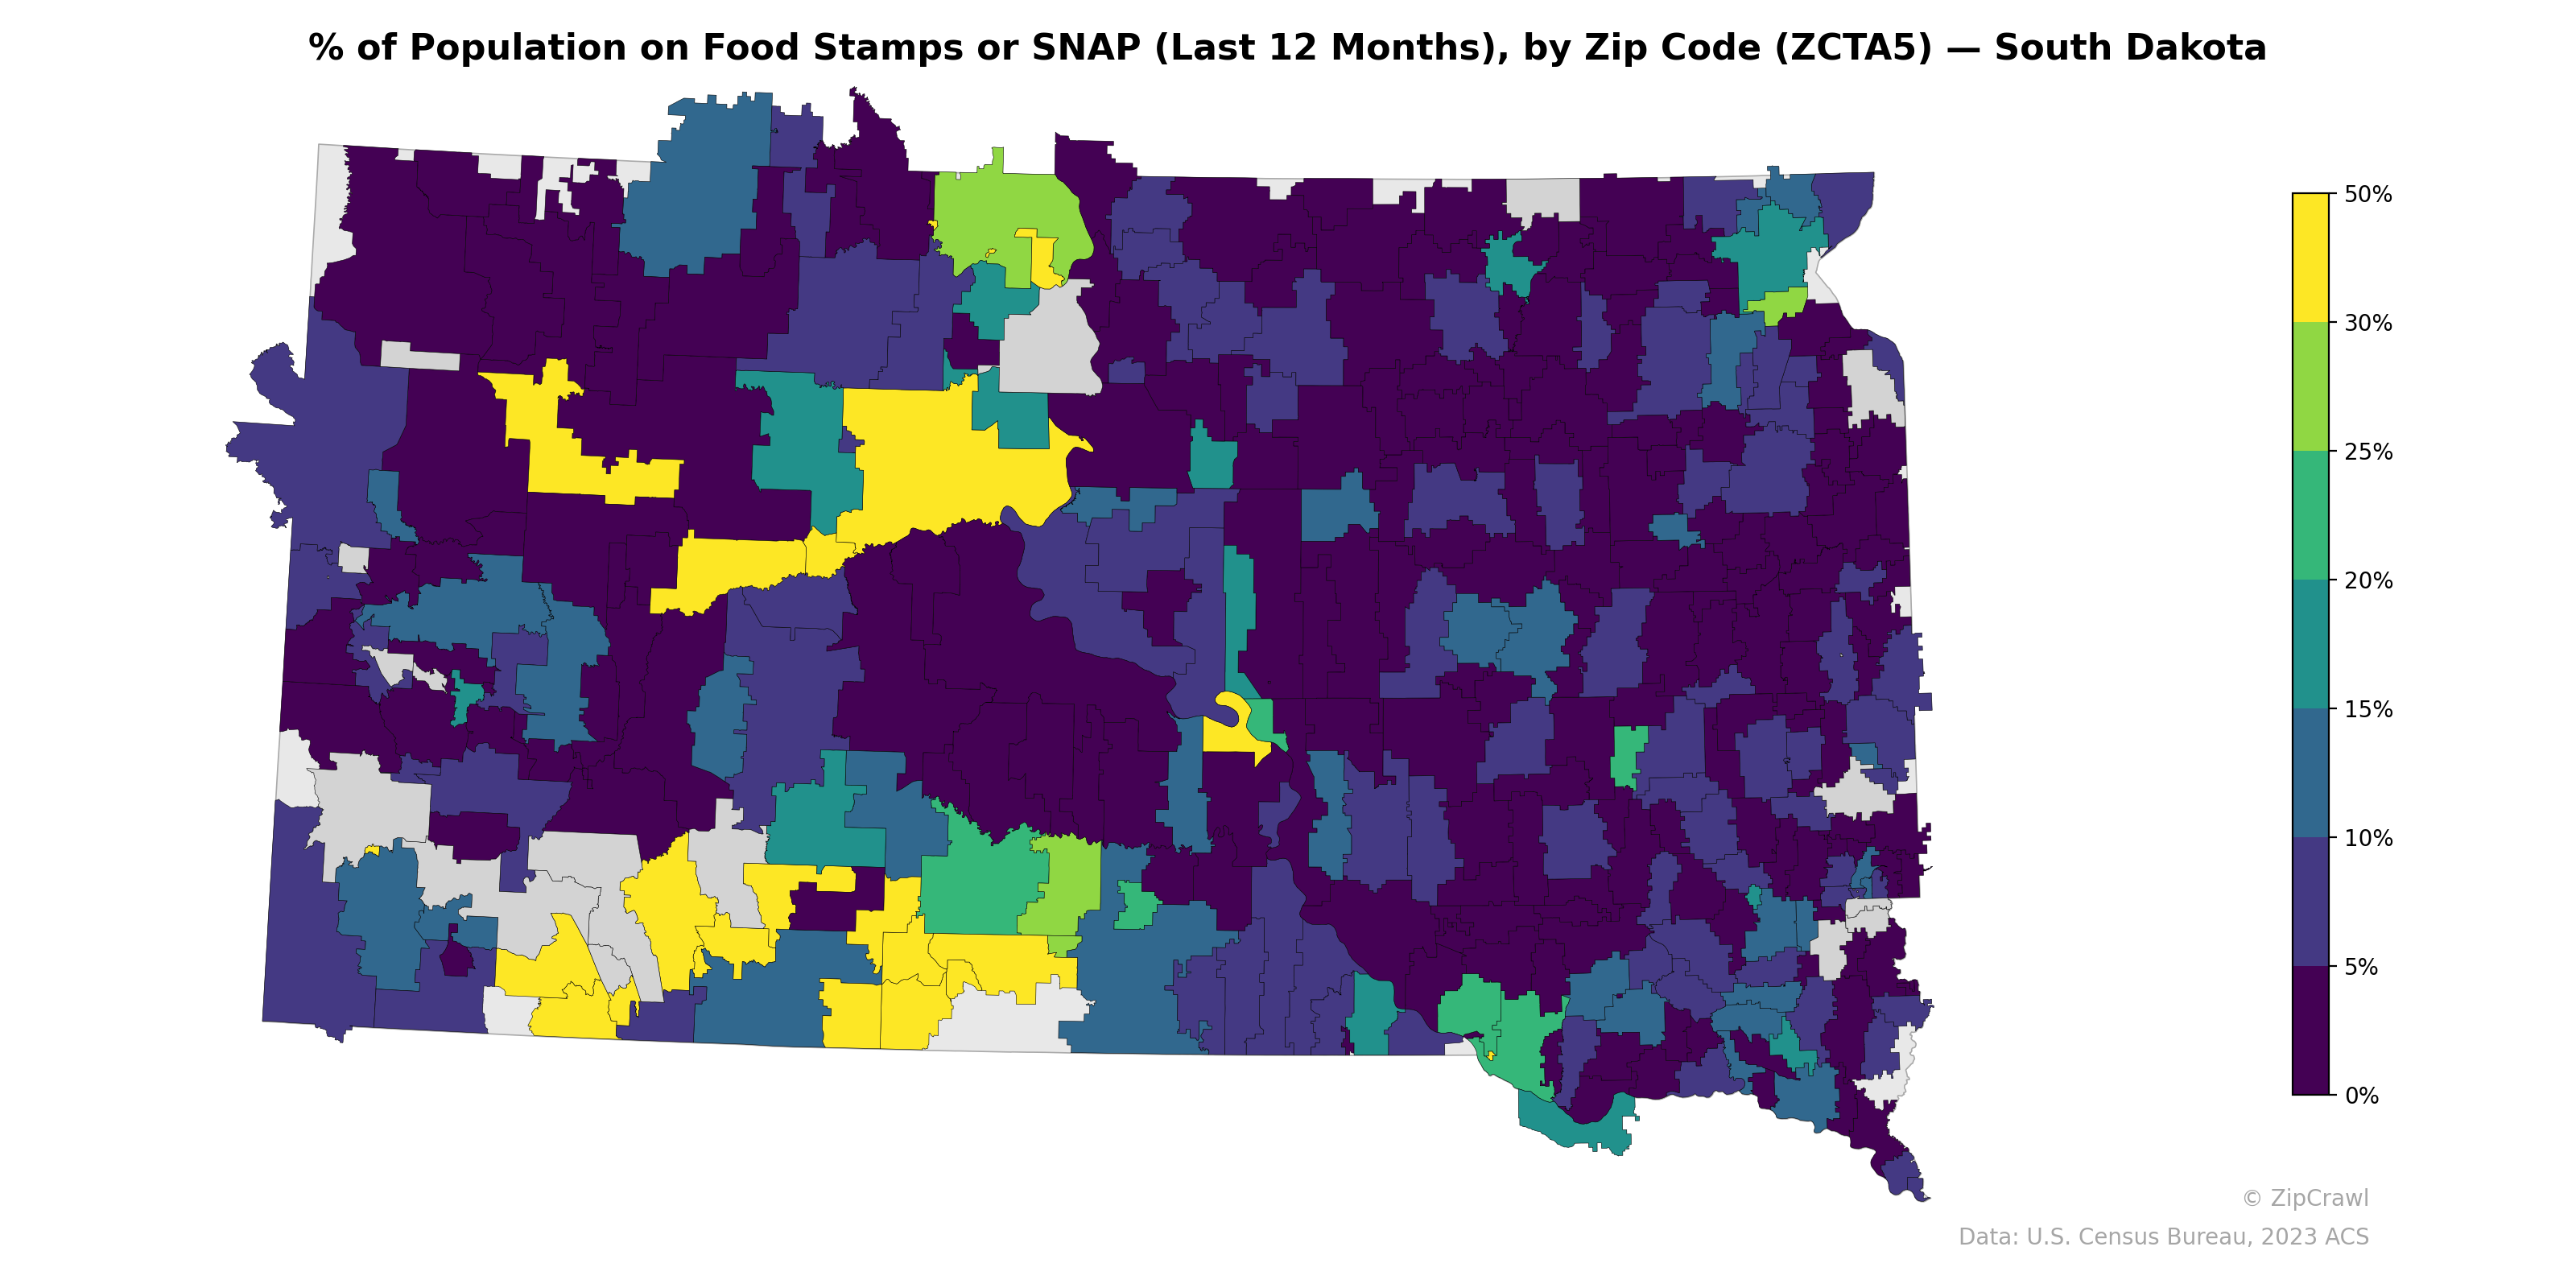
Zip codes in western South Dakota, particularly those overlapping the Pine Ridge and Cheyenne River reservations, display the highest SNAP participation rates, frequently exceeding 30–50%, forming a pronounced cluster of food assistance dependency. Central and eastern regions of the state generally exhibit lower rates in the 0–10% range, though notable exceptions appear in urban centers like Sioux Falls and areas in the southeast where select zip codes reach 15–25%. The starkest contrasts occur between reservation communities in the west and the agricultural zip codes of the central plains, where SNAP usage often falls below 5%.
Data: U.S. Census Bureau, 2023 ACS
Explore
- Housing Owner-Occupied % of Units, by Zip Code (ZCTA5) — New York
- Housing Median Monthly Rent ($), by Zip Code (ZCTA5) — New York
- Married Couple (% of all Households) by Zip Code (ZCTA5) — South Dakota
- Population Non-Hispanic Asian % by Zip Code (ZCTA5) — South Dakota
- Population Hispanic % by Zip Code (ZCTA5) — North Dakota
- Population Non-Hispanic Black % by Zip Code (ZCTA5) — North Dakota
- Household Median Income by Zip Code (ZCTA5) — North Dakota
- Population Non-Hispanic White % by Zip Code (ZCTA5) — North Dakota
- Median Age by Zip Code (ZCTA5) — North Dakota
- Housing Vacancy Rate by Zip Code (ZCTA5) — South Dakota
- U.S. Citizens (% of Population Over 18) by Zip Code (ZCTA5) — North Dakota
- Household Average Size by County
- Housing Owner-Occupied % of Units, by Zip Code (ZCTA5) — Indiana
- Household Average Size by Zip Code (ZCTA5) — New York
- Married Couple (% of all Households) by Zip Code (ZCTA5) — New York
- Housing Owner-Occupied Median Value ($), by Zip Code (ZCTA5) — New York
- % of Households with Broadband Internet, by Zip Code (ZCTA5) — New York
- % of Population without Health Insurance, by Zip Code (ZCTA5) — New York
- Housing Vacancy Rate by Zip Code (ZCTA5) — New York
- Bachelor's Degree or Higher (% of Over 25) by Zip Code (ZCTA5) — New York
- Housing % of Units Built Since 2010, by Zip Code (ZCTA5) — New York
- Population Non-Hispanic American Indian % by Zip Code (ZCTA5) — North Dakota
- Population Non-Hispanic American Indian % by Zip Code (ZCTA5) — Rhode Island
- Married Couple (% of all Households) by Zip Code (ZCTA5) — Rhode Island
- High School Graduate (% of Over 25) by Zip Code (ZCTA5) — Rhode Island
- Housing % of Units Built Since 2010, by Zip Code (ZCTA5) — Rhode Island
- Housing Vacancy Rate by Zip Code (ZCTA5) — Alaska
- Household Median Income by Zip Code (ZCTA5) — Oregon
- Household Average Size by Zip Code (ZCTA5) — Rhode Island
- Housing Vacancy Rate by Zip Code (ZCTA5) — Rhode Island
- % of Population on Food Stamps or SNAP (Last 12 Months), by Zip Code (ZCTA5) — North Dakota
- % of Population on Food Stamps or SNAP (Last 12 Months), by Zip Code (ZCTA5) — South Carolina
- % of Population on Food Stamps or SNAP (Last 12 Months), by Zip Code (ZCTA5) — Ohio
- % of Population on Food Stamps or SNAP (Last 12 Months), by Zip Code (ZCTA5) — Montana
- % of Population on Food Stamps or SNAP (Last 12 Months), by Zip Code (ZCTA5) — Oregon
- % of Population on Food Stamps or SNAP (Last 12 Months), by Zip Code (ZCTA5) — Minnesota
- % of Population on Food Stamps or SNAP (Last 12 Months), by Zip Code (ZCTA5) — Iowa
- % of Population on Food Stamps or SNAP (Last 12 Months), by Zip Code (ZCTA5) — Utah
- % of Population on Food Stamps or SNAP (Last 12 Months), by Zip Code (ZCTA5) — Maine
- % of Population on Food Stamps or SNAP (Last 12 Months), by Zip Code (ZCTA5) — Missouri