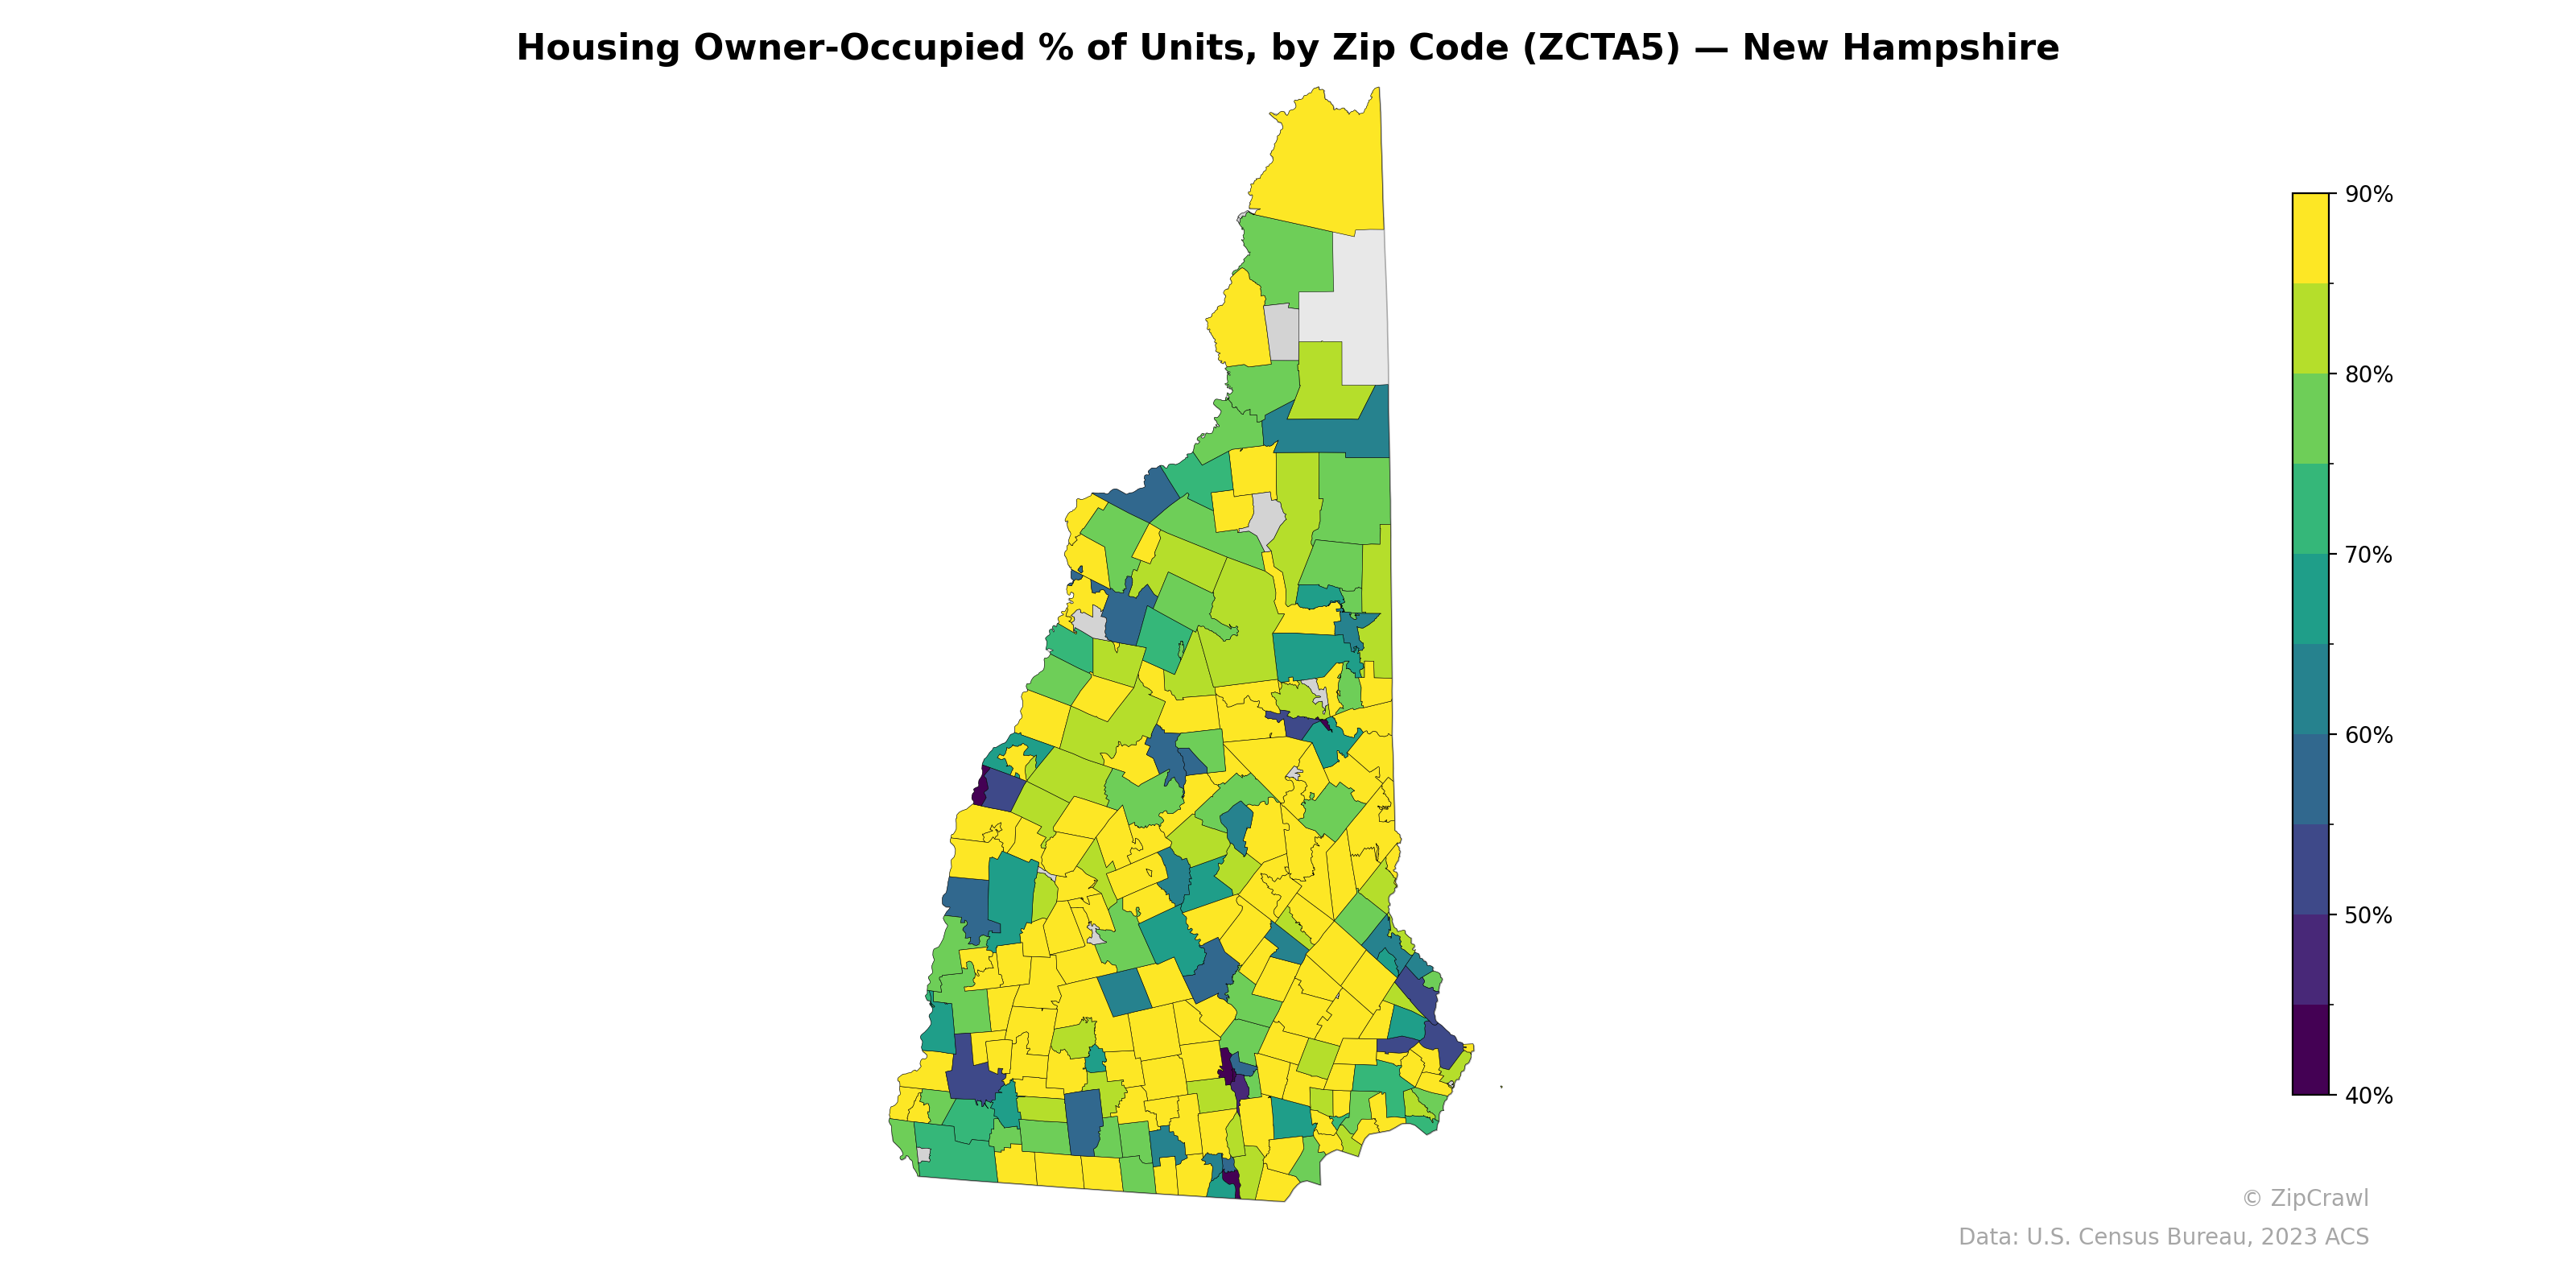
NOTE: Gray indicates insufficient data or a suppressed estimate.
The northern tip of New Hampshire near the Canadian border exhibits consistently high owner-occupancy rates above 85%, while a distinct corridor of lower owner-occupancy (40–55%) runs through the central-western part of the state, likely corresponding to the Lebanon-Hanover area and college-town rental markets. Southern New Hampshire displays a patchwork pattern, with predominantly yellow high-ownership suburban zip codes interspersed with pockets of significantly lower rates in urban centers such as Manchester, Nashua, and Concord. The seacoast region along the southeastern border also trends toward lower owner-occupancy, reflecting higher housing costs and denser rental stock in the Portsmouth area.
Data: U.S. Census Bureau, 2023 ACS
Explore
- Population Non-Hispanic White % by Zip Code (ZCTA5) — New York
- Median Age by Zip Code (ZCTA5) — New York
- Housing Median Monthly Rent ($), by Zip Code (ZCTA5) — New Hampshire
- Bachelor's Degree or Higher (% of Over 25) by Zip Code (ZCTA5) — New Hampshire
- Household Average Size by Zip Code (ZCTA5) — New Hampshire
- Housing % of Units Built Since 2010, by Zip Code (ZCTA5) — New Hampshire
- % of Population without Health Insurance, by Zip Code (ZCTA5) — New Hampshire
- Population Non-Hispanic American Indian % by Zip Code (ZCTA5) — New Hampshire
- High School Graduate (% of Over 25) by Zip Code (ZCTA5) — New Hampshire
- % of Households with Broadband Internet, by Zip Code (ZCTA5) — New Hampshire
- Housing Owner-Occupied Median Value ($), by Zip Code (ZCTA5) — New Hampshire
- U.S. Citizens by County (% of Population Over 18)
- Population Non-Hispanic White % by Zip Code (ZCTA5) — Virginia
- High School Graduate (% of Over 25) by Zip Code (ZCTA5) — New York
- Household Median Income by Zip Code (ZCTA5) — New York
- Population Non-Hispanic Black % by Zip Code (ZCTA5) — New York
- Population Hispanic % by Zip Code (ZCTA5) — New York
- Population Non-Hispanic Asian % by Zip Code (ZCTA5) — Florida
- % of Population on Food Stamps or SNAP (Last 12 Months), by Zip Code (ZCTA5) — Florida
- U.S. Citizens (% of Population Over 18) by Zip Code (ZCTA5) — New York
- Population Non-Hispanic American Indian % by Zip Code (ZCTA5) — New York
- Population Non-Hispanic Asian % by Zip Code (ZCTA5) — West Virginia
- % of Population without Health Insurance, by Zip Code (ZCTA5) — West Virginia
- % of Population on Food Stamps or SNAP (Last 12 Months), by Zip Code (ZCTA5) — West Virginia
- Population Hispanic % by Zip Code (ZCTA5) — Hawaii
- Population Non-Hispanic American Indian % by Zip Code (ZCTA5) — West Virginia
- Bachelor's Degree or Higher (% of Over 25) by Zip Code (ZCTA5) — West Virginia
- High School Graduate (% of Over 25) by Zip Code (ZCTA5) — West Virginia
- % of Households with Broadband Internet, by Zip Code (ZCTA5) — West Virginia
- Population Non-Hispanic Black % by Zip Code (ZCTA5) — Hawaii
- Housing Owner-Occupied % of Units, by Zip Code (ZCTA5) — New York
- Housing Owner-Occupied % of Units, by Zip Code (ZCTA5) — New Jersey
- Housing Owner-Occupied % of Units, by Zip Code (ZCTA5) — New Mexico
- Housing Owner-Occupied % of Units, by Zip Code (ZCTA5) — Nevada
- Housing Owner-Occupied % of Units, by Zip Code (ZCTA5) — Hawaii
- Housing Owner-Occupied % of Units, by Zip Code (ZCTA5) — Utah
- Housing Owner-Occupied % of Units, by Zip Code (ZCTA5) — Ohio
- Housing Owner-Occupied % of Units, by Zip Code (ZCTA5) — Nebraska
- Housing Owner-Occupied % of Units, by Zip Code (ZCTA5) — Iowa
- Housing Owner-Occupied % of Units, by Zip Code (ZCTA5) — Texas