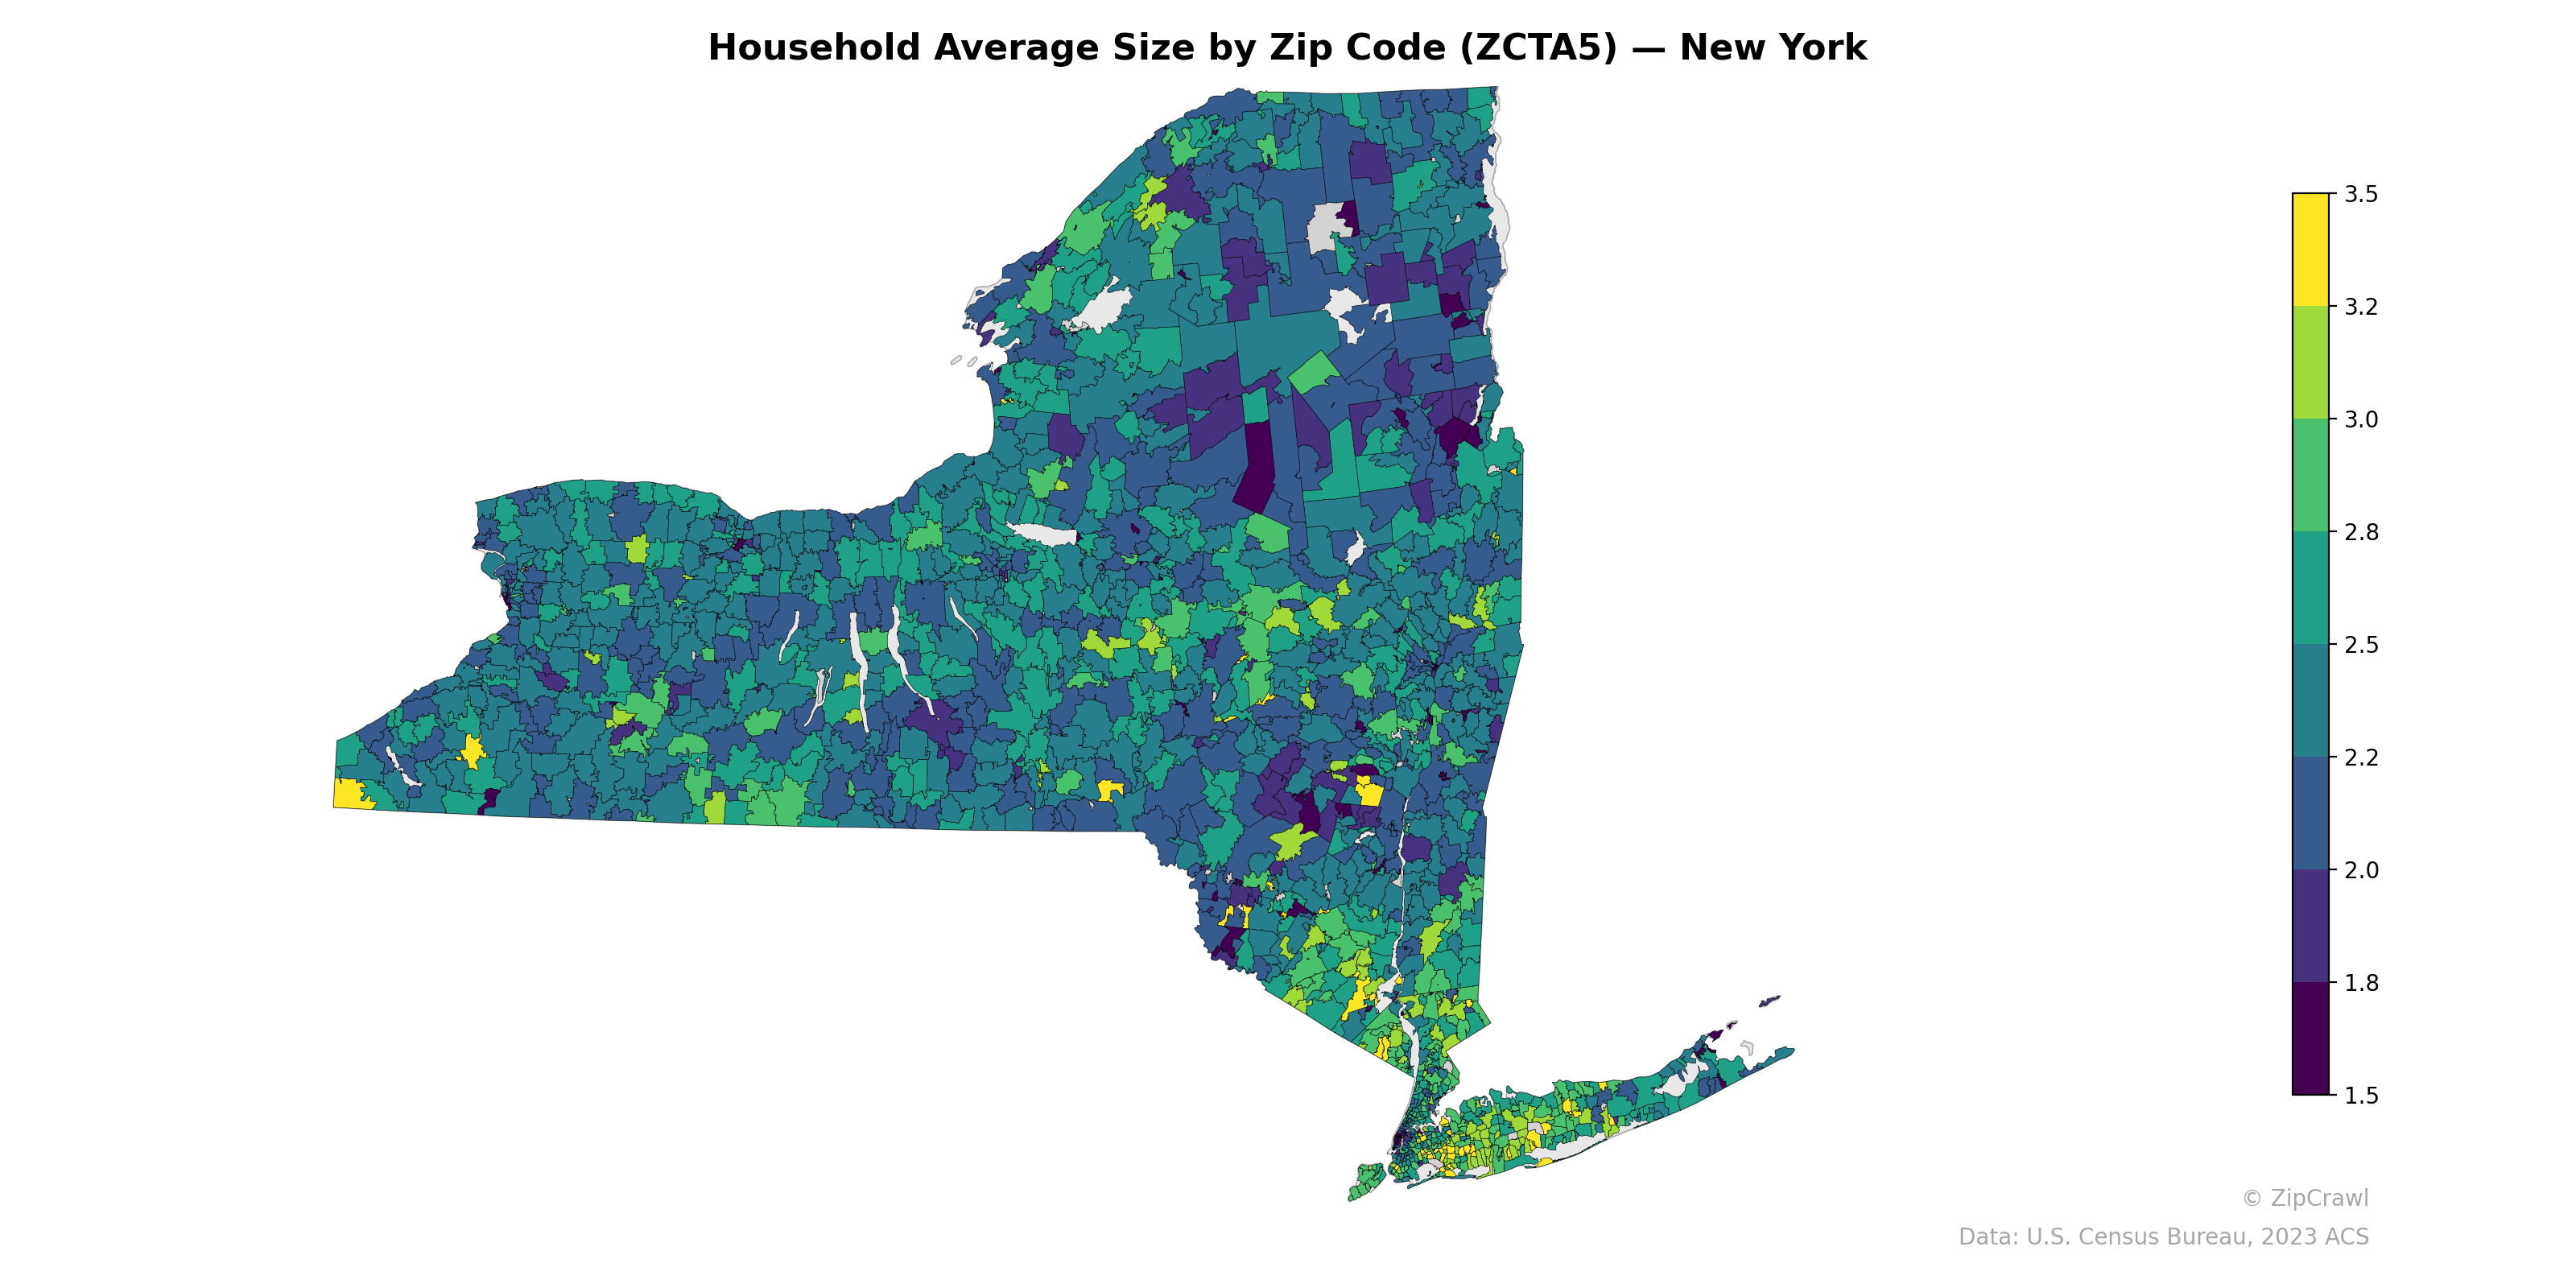
NOTE: Gray indicates insufficient data or a suppressed estimate.
Household sizes across New York State display a pronounced urban-suburban divide, with Manhattan and parts of downtown Brooklyn exhibiting the smallest average households (around 1.5–2.0 persons), while suburban zip codes in Staten Island, outer Queens, and Rockland/Orange counties cluster at the higher end (3.0–3.5+). Upstate New York generally falls in the moderate range of 2.2–2.8, though college towns and small cities such as those near Ithaca, Albany, and Syracuse show notably lower values driven by student and single-occupant housing. The southwestern tier and Adirondack regions display considerable heterogeneity at the zip code level, suggesting localized variation tied to rural community composition rather than broad regional trends.
Data: U.S. Census Bureau, 2023 ACS
Explore
- Population Non-Hispanic White % by Zip Code (ZCTA5) — Oregon
- Household Median Income by Zip Code (ZCTA5) — Alaska
- Population Hispanic % by Zip Code (ZCTA5) — Alaska
- Population Non-Hispanic White % by Zip Code (ZCTA5) — Alaska
- Median Age by Zip Code (ZCTA5) — Alaska
- % of Population on Food Stamps or SNAP (Last 12 Months), by Zip Code (ZCTA5) — North Dakota
- Population Non-Hispanic Asian % by Zip Code (ZCTA5) — North Dakota
- Housing Vacancy Rate by Zip Code (ZCTA5) — North Dakota
- Population Non-Hispanic White % by Zip Code (ZCTA5) — North Dakota
- Married Couple (% of all Households) by Zip Code (ZCTA5) — North Dakota
- U.S. Citizens (% of Population Over 18) by Zip Code (ZCTA5) — Alaska
- Population Non-Hispanic Black % by Zip Code (ZCTA5) — Alaska
- Housing Owner-Occupied Median Value ($), by Zip Code (ZCTA5) — New York
- Housing Median Monthly Rent ($), by Zip Code (ZCTA5) — New York
- Housing Owner-Occupied % of Units, by Zip Code (ZCTA5) — New York
- Housing % of Units Built Since 2010, by Zip Code (ZCTA5) — New York
- Housing Vacancy Rate by Zip Code (ZCTA5) — New York
- Bachelor's Degree or Higher (% of Over 25) by Zip Code (ZCTA5) — New York
- % of Households with Broadband Internet, by Zip Code (ZCTA5) — New York
- % of Population without Health Insurance, by Zip Code (ZCTA5) — New York
- Married Couple (% of all Households) by Zip Code (ZCTA5) — New York
- Married Couple (% of all Households) by Zip Code (ZCTA5) — Rhode Island
- High School Graduate (% of Over 25) by Zip Code (ZCTA5) — Rhode Island
- Housing Vacancy Rate by Zip Code (ZCTA5) — Rhode Island
- Population Non-Hispanic Black % by Zip Code (ZCTA5) — North Dakota
- Housing Vacancy Rate by Zip Code (ZCTA5) — Alaska
- Population Non-Hispanic White % by Zip Code (ZCTA5) — Maine
- Population Non-Hispanic American Indian % by Zip Code (ZCTA5) — North Dakota
- Population Non-Hispanic American Indian % by Zip Code (ZCTA5) — Rhode Island
- Bachelor's Degree or Higher (% of Over 25) by Zip Code (ZCTA5) — Rhode Island
- Household Average Size by Zip Code (ZCTA5) — New York Metro
- Household Average Size by Zip Code (ZCTA5) — New Mexico
- Household Average Size by Zip Code (ZCTA5) — New Jersey
- Household Average Size by Zip Code (ZCTA5) — Nevada
- Household Average Size by Zip Code (ZCTA5) — New Hampshire
- Household Average Size by Zip Code (ZCTA5) — Nebraska
- Household Average Size by Zip Code (ZCTA5) — Utah
- Household Average Size by Zip Code (ZCTA5) — Ohio
- Household Average Size by Zip Code (ZCTA5) — Iowa
- Household Average Size by Zip Code (ZCTA5) — Texas