NOTE: Gray indicates insufficient data or a suppressed estimate.
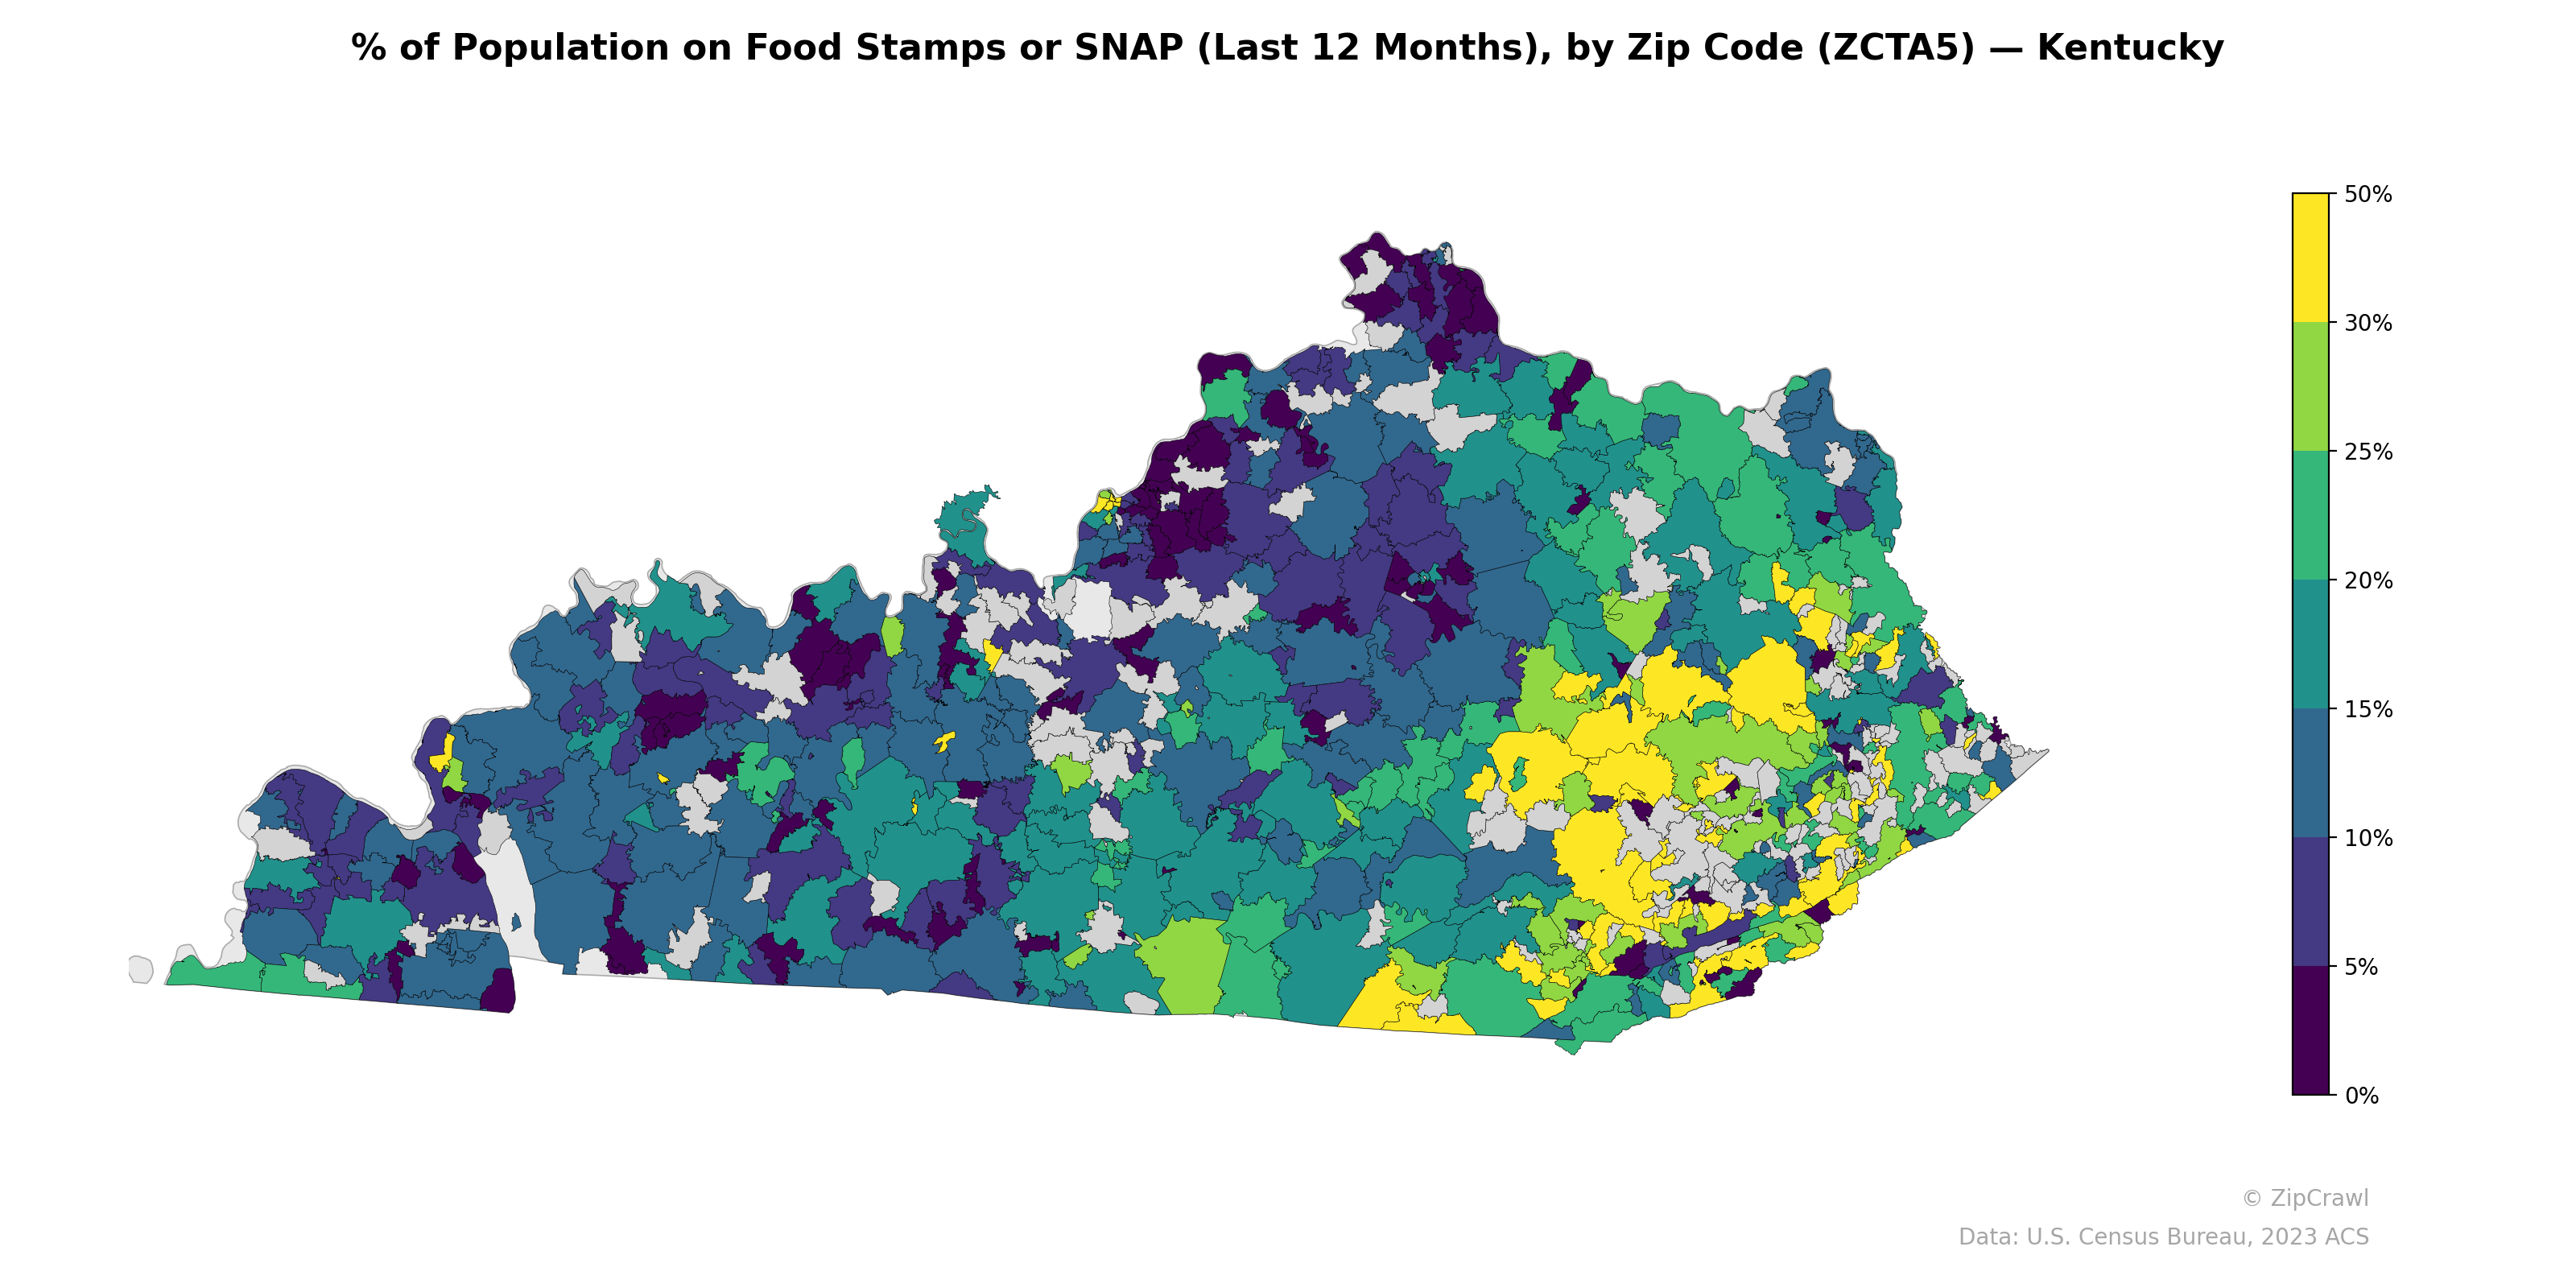
Eastern Kentucky's Appalachian region exhibits the highest SNAP participation rates, with numerous zip codes in the southeastern coalfield counties reaching 35–50%, consistent with the area's persistent poverty and economic distress. The western portion of the state displays considerable heterogeneity, with pockets of very low participation (under 5%) interspersed among moderate-rate areas, while urban centers like Louisville and Lexington contain sharp contrasts between adjacent zip codes ranging from under 5% to over 25%. The lowest SNAP utilization rates cluster in suburban and exurban zip codes surrounding major metropolitan areas, particularly in the northern Kentucky suburbs near Cincinnati and the counties ringing Lexington.
Data: U.S. Census Bureau, 2023 ACS
Explore
- Population Non-Hispanic White % by Zip Code (ZCTA5) — California
- Housing Vacancy Rate by Zip Code (ZCTA5) — Kentucky
- Married Couple (% of all Households) by Zip Code (ZCTA5) — Kentucky
- Population Non-Hispanic Asian % by Zip Code (ZCTA5) — Kentucky
- % of Households with Broadband Internet, by County
- Median Age by Zip Code (ZCTA5) — California
- U.S. Citizens (% of Population Over 18) by Zip Code (ZCTA5) — California
- Population Non-Hispanic American Indian % by Zip Code (ZCTA5) — California
- Population Hispanic % by Zip Code (ZCTA5) — California
- High School Graduate (% of Over 25) by Zip Code (ZCTA5) — California
- Population Non-Hispanic Asian % by Zip Code (ZCTA5) — Texas
- Household Median Income by Zip Code (ZCTA5) — California
- Housing Owner-Occupied % of Units, by Zip Code (ZCTA5) — New York
- Population Non-Hispanic Black % by Zip Code (ZCTA5) — California
- Housing Owner-Occupied Median Value ($), by Zip Code (ZCTA5) — Alabama
- Housing Owner-Occupied % of Units, by Zip Code (ZCTA5) — Alabama
- Housing Median Monthly Rent ($), by Zip Code (ZCTA5) — Alabama
- Household Average Size by Zip Code (ZCTA5) — Alabama
- % of Households with Broadband Internet, by Zip Code (ZCTA5) — Alabama
- Housing % of Units Built Since 2010, by Zip Code (ZCTA5) — Alabama
- Married Couple (% of all Households) by Zip Code (ZCTA5) — Alabama
- High School Graduate (% of Over 25) by Zip Code (ZCTA5) — Alabama
- Bachelor's Degree or Higher (% of Over 25) by Zip Code (ZCTA5) — Alabama
- Population Non-Hispanic American Indian % by Zip Code (ZCTA5) — Alabama
- Population Non-Hispanic White % by Zip Code (ZCTA5) — Louisiana
- Housing Vacancy Rate by Zip Code (ZCTA5) — Alabama
- U.S. Citizens (% of Population Over 18) by Zip Code (ZCTA5) — Louisiana
- % of Population without Health Insurance, by Zip Code (ZCTA5) — Alabama
- Household Median Income by Zip Code (ZCTA5) — Louisiana
- Population Non-Hispanic Asian % by Zip Code (ZCTA5) — Alabama
- % of Population on Food Stamps or SNAP (Last 12 Months), by Zip Code (ZCTA5) — Ohio
- % of Population on Food Stamps or SNAP (Last 12 Months), by Zip Code (ZCTA5) — Montana
- % of Population on Food Stamps or SNAP (Last 12 Months), by Zip Code (ZCTA5) — Oregon
- % of Population on Food Stamps or SNAP (Last 12 Months), by Zip Code (ZCTA5) — Kansas
- % of Population on Food Stamps or SNAP (Last 12 Months), by Zip Code (ZCTA5) — Utah
- % of Population on Food Stamps or SNAP (Last 12 Months), by Zip Code (ZCTA5) — Iowa
- % of Population on Food Stamps or SNAP (Last 12 Months), by Zip Code (ZCTA5) — Maine
- % of Population on Food Stamps or SNAP (Last 12 Months), by Zip Code (ZCTA5) — Idaho
- % of Population on Food Stamps or SNAP (Last 12 Months), by Zip Code (ZCTA5) — Texas
- % of Population on Food Stamps or SNAP (Last 12 Months), by Zip Code (ZCTA5) — Alaska