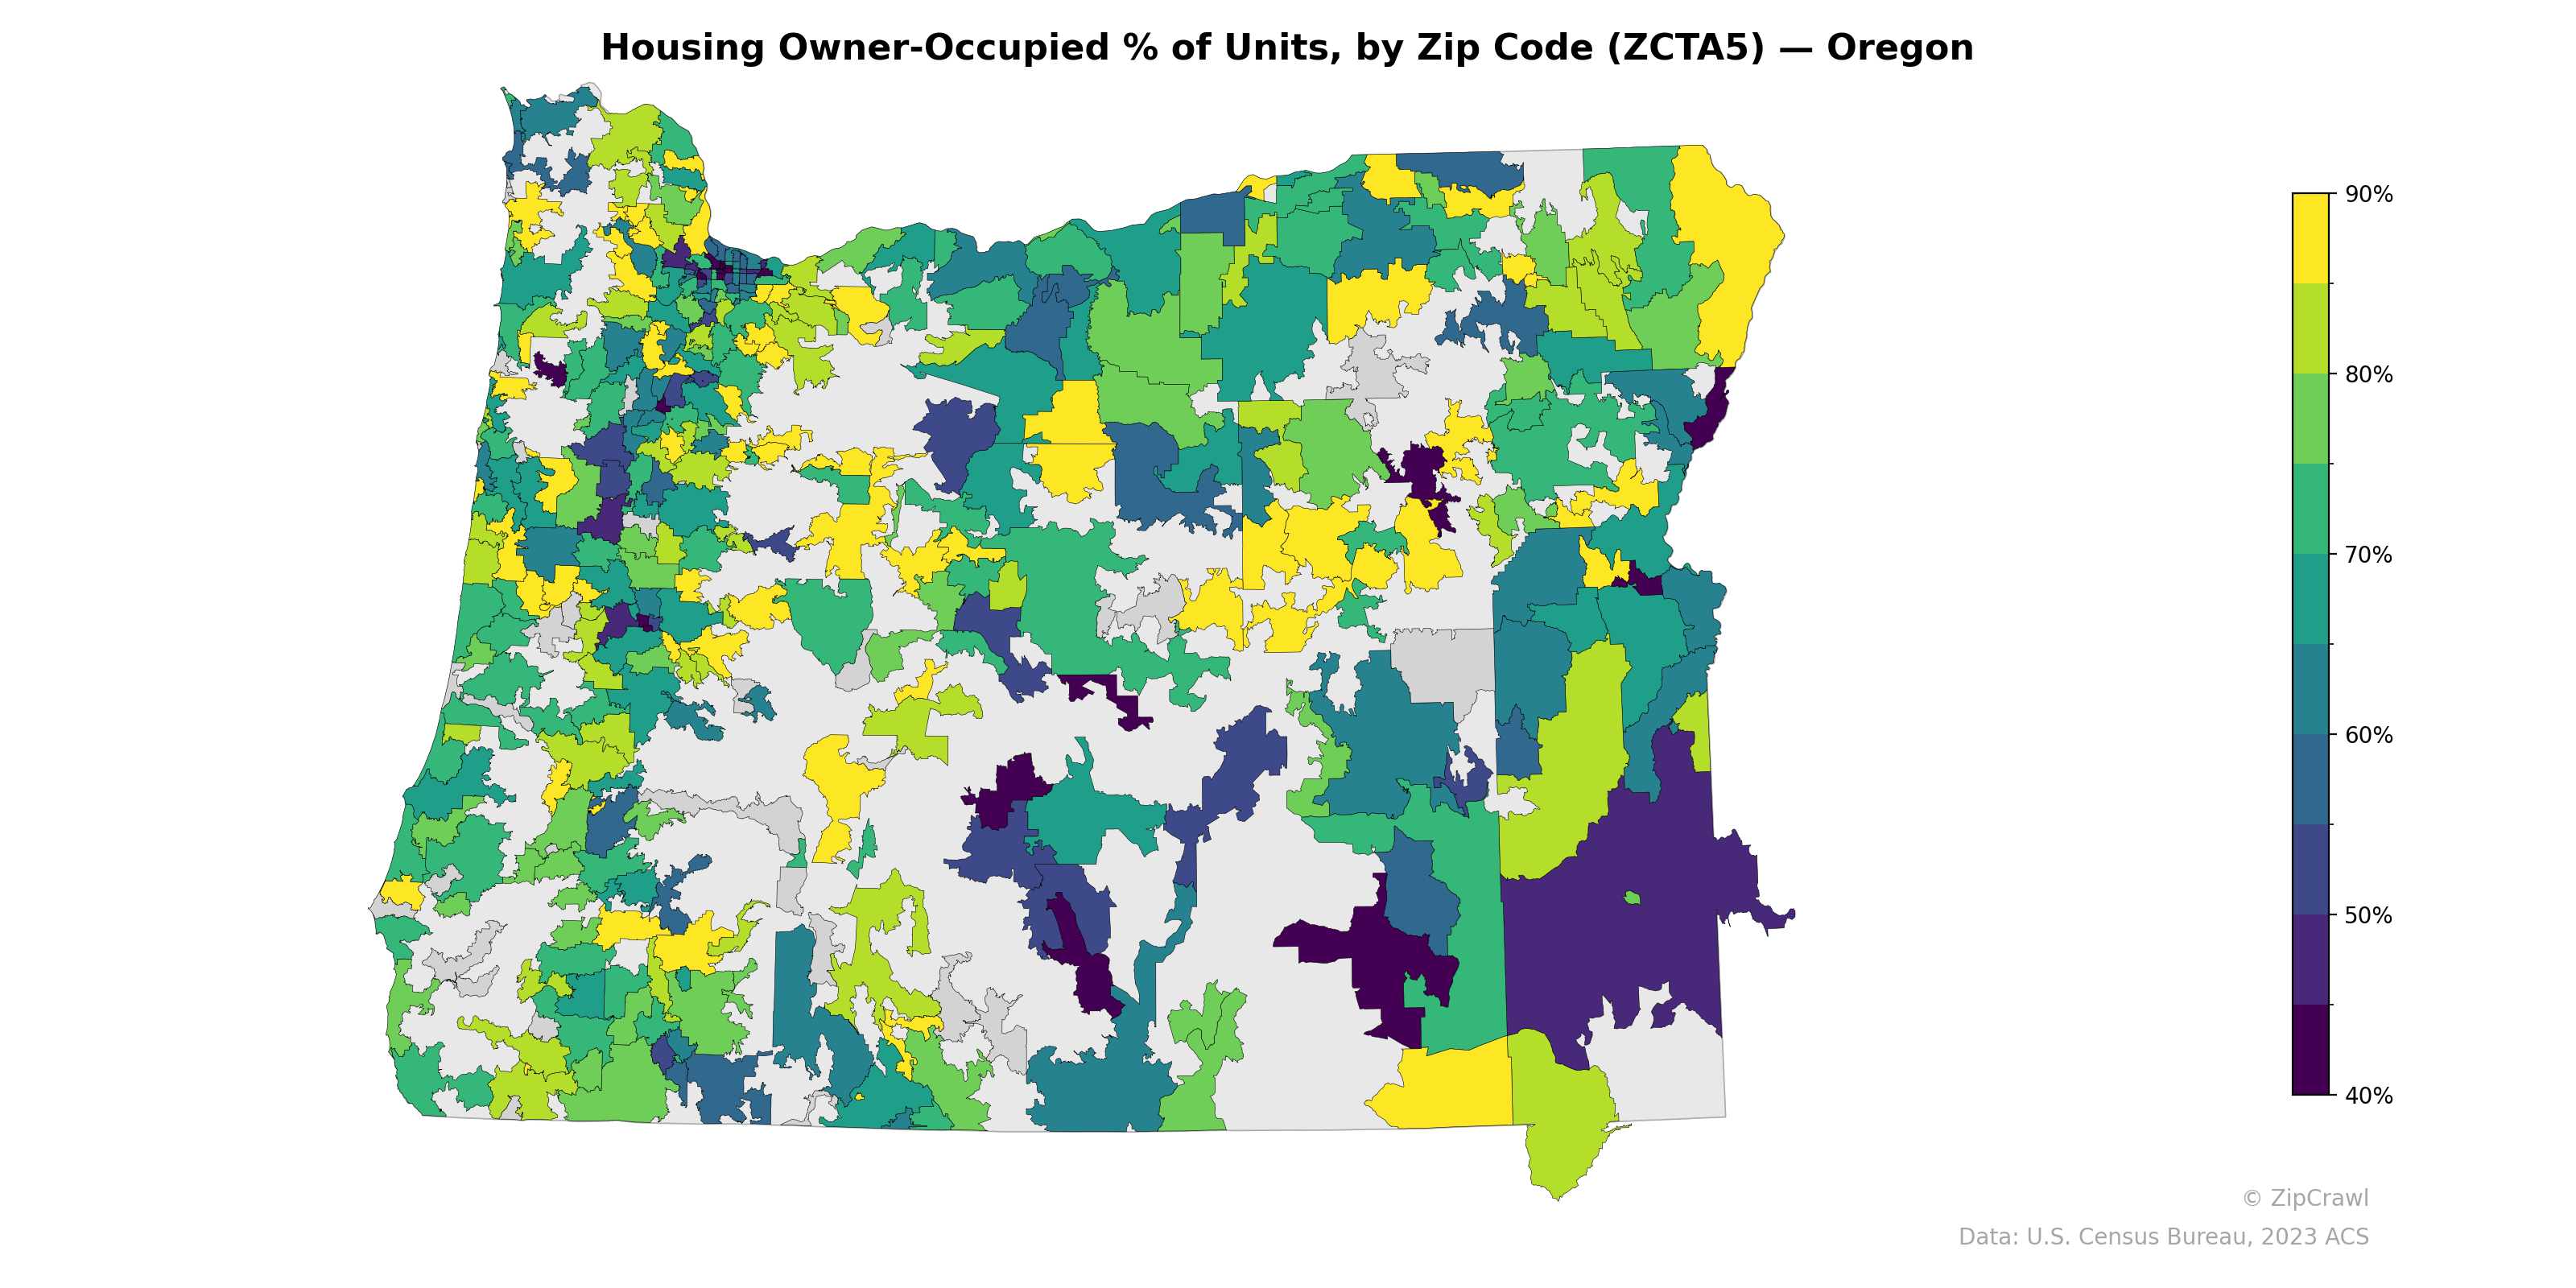
NOTE: Gray indicates insufficient data or a suppressed estimate.
Owner-occupancy rates across Oregon exhibit a clear urban-rural divide, with the Portland metro area in the northwest displaying notably lower homeownership percentages (dark purple and teal tones, often below 50-60%) compared to many rural and suburban zip codes that reach 80-90%. The southeastern corner of the state, particularly in Harney and Malheur county areas, shows a striking cluster of very low owner-occupancy rates (deep purple), likely reflecting a combination of sparse population, seasonal housing, and agricultural rental properties. Coastal zip codes and the Willamette Valley present a patchwork pattern with significant variation between adjacent zip codes, suggesting localized housing market dynamics driven by factors such as college towns (Corvallis, Eugene), resort communities, and retirement destinations.
Data: U.S. Census Bureau, 2023 ACS
Explore
- Housing % of Units Built Since 2010, by Zip Code (ZCTA5) — California
- Population Non-Hispanic White % by Zip Code (ZCTA5) — Illinois
- Household Average Size by Zip Code (ZCTA5) — Oregon
- % of Households with Broadband Internet, by Zip Code (ZCTA5) — Oregon
- Population Non-Hispanic American Indian % by Zip Code (ZCTA5) — Oregon
- % of Population without Health Insurance, by Zip Code (ZCTA5) — Oregon
- Housing Owner-Occupied Median Value ($), by Zip Code (ZCTA5) — Oregon
- Housing Median Monthly Rent ($), by Zip Code (ZCTA5) — Oregon
- Housing % of Units Built Since 2010, by Zip Code (ZCTA5) — Oregon
- Bachelor's Degree or Higher (% of Over 25) by Zip Code (ZCTA5) — Oregon
- High School Graduate (% of Over 25) by Zip Code (ZCTA5) — Oregon
- % of Population without Health Insurance, by Zip Code (ZCTA5) — California
- Married Couple (% of all Households) by Zip Code (ZCTA5) — California
- % of Households with Broadband Internet, by Zip Code (ZCTA5) — California
- Bachelor's Degree or Higher (% of Over 25) by Zip Code (ZCTA5) — California
- Household Average Size by Zip Code (ZCTA5) — California
- Housing Vacancy Rate by Zip Code (ZCTA5) — California
- Housing Owner-Occupied Median Value ($), by Zip Code (ZCTA5) — California
- Housing Median Monthly Rent ($), by Zip Code (ZCTA5) — California
- Married Couple (% of all Households) by Zip Code (ZCTA5) — Oregon
- Housing Vacancy Rate by Zip Code (ZCTA5) — Oregon
- Population Non-Hispanic Black % by Zip Code (ZCTA5) — Oregon
- Population Non-Hispanic Asian % by Zip Code (ZCTA5) — Oregon
- Median Age by Zip Code (ZCTA5) — Oregon
- U.S. Citizens (% of Population Over 18) by Zip Code (ZCTA5) — Oregon
- Household Median Income by Zip Code (ZCTA5) — Oregon
- Population Non-Hispanic White % by Zip Code (ZCTA5) — Oregon
- Population Hispanic % by Zip Code (ZCTA5) — Oregon
- % of Population on Food Stamps or SNAP (Last 12 Months), by Zip Code (ZCTA5) — Oregon
- U.S. Citizens (% of Population Over 18) by Zip Code (ZCTA5) — Oklahoma
- Housing Owner-Occupied % of Units, by Zip Code (ZCTA5) — Utah
- Housing Owner-Occupied % of Units, by Zip Code (ZCTA5) — Ohio
- Housing Owner-Occupied % of Units, by Zip Code (ZCTA5) — Iowa
- Housing Owner-Occupied % of Units, by Zip Code (ZCTA5) — Texas
- Housing Owner-Occupied % of Units, by Zip Code (ZCTA5) — Idaho
- Housing Owner-Occupied % of Units, by Zip Code (ZCTA5) — Wyoming
- Housing Owner-Occupied % of Units, by Zip Code (ZCTA5) — Hawaii
- Housing Owner-Occupied % of Units, by Zip Code (ZCTA5) — Maine
- Housing Owner-Occupied % of Units, by Zip Code (ZCTA5) — Nevada
- Housing Owner-Occupied % of Units, by Zip Code (ZCTA5) — Kansas