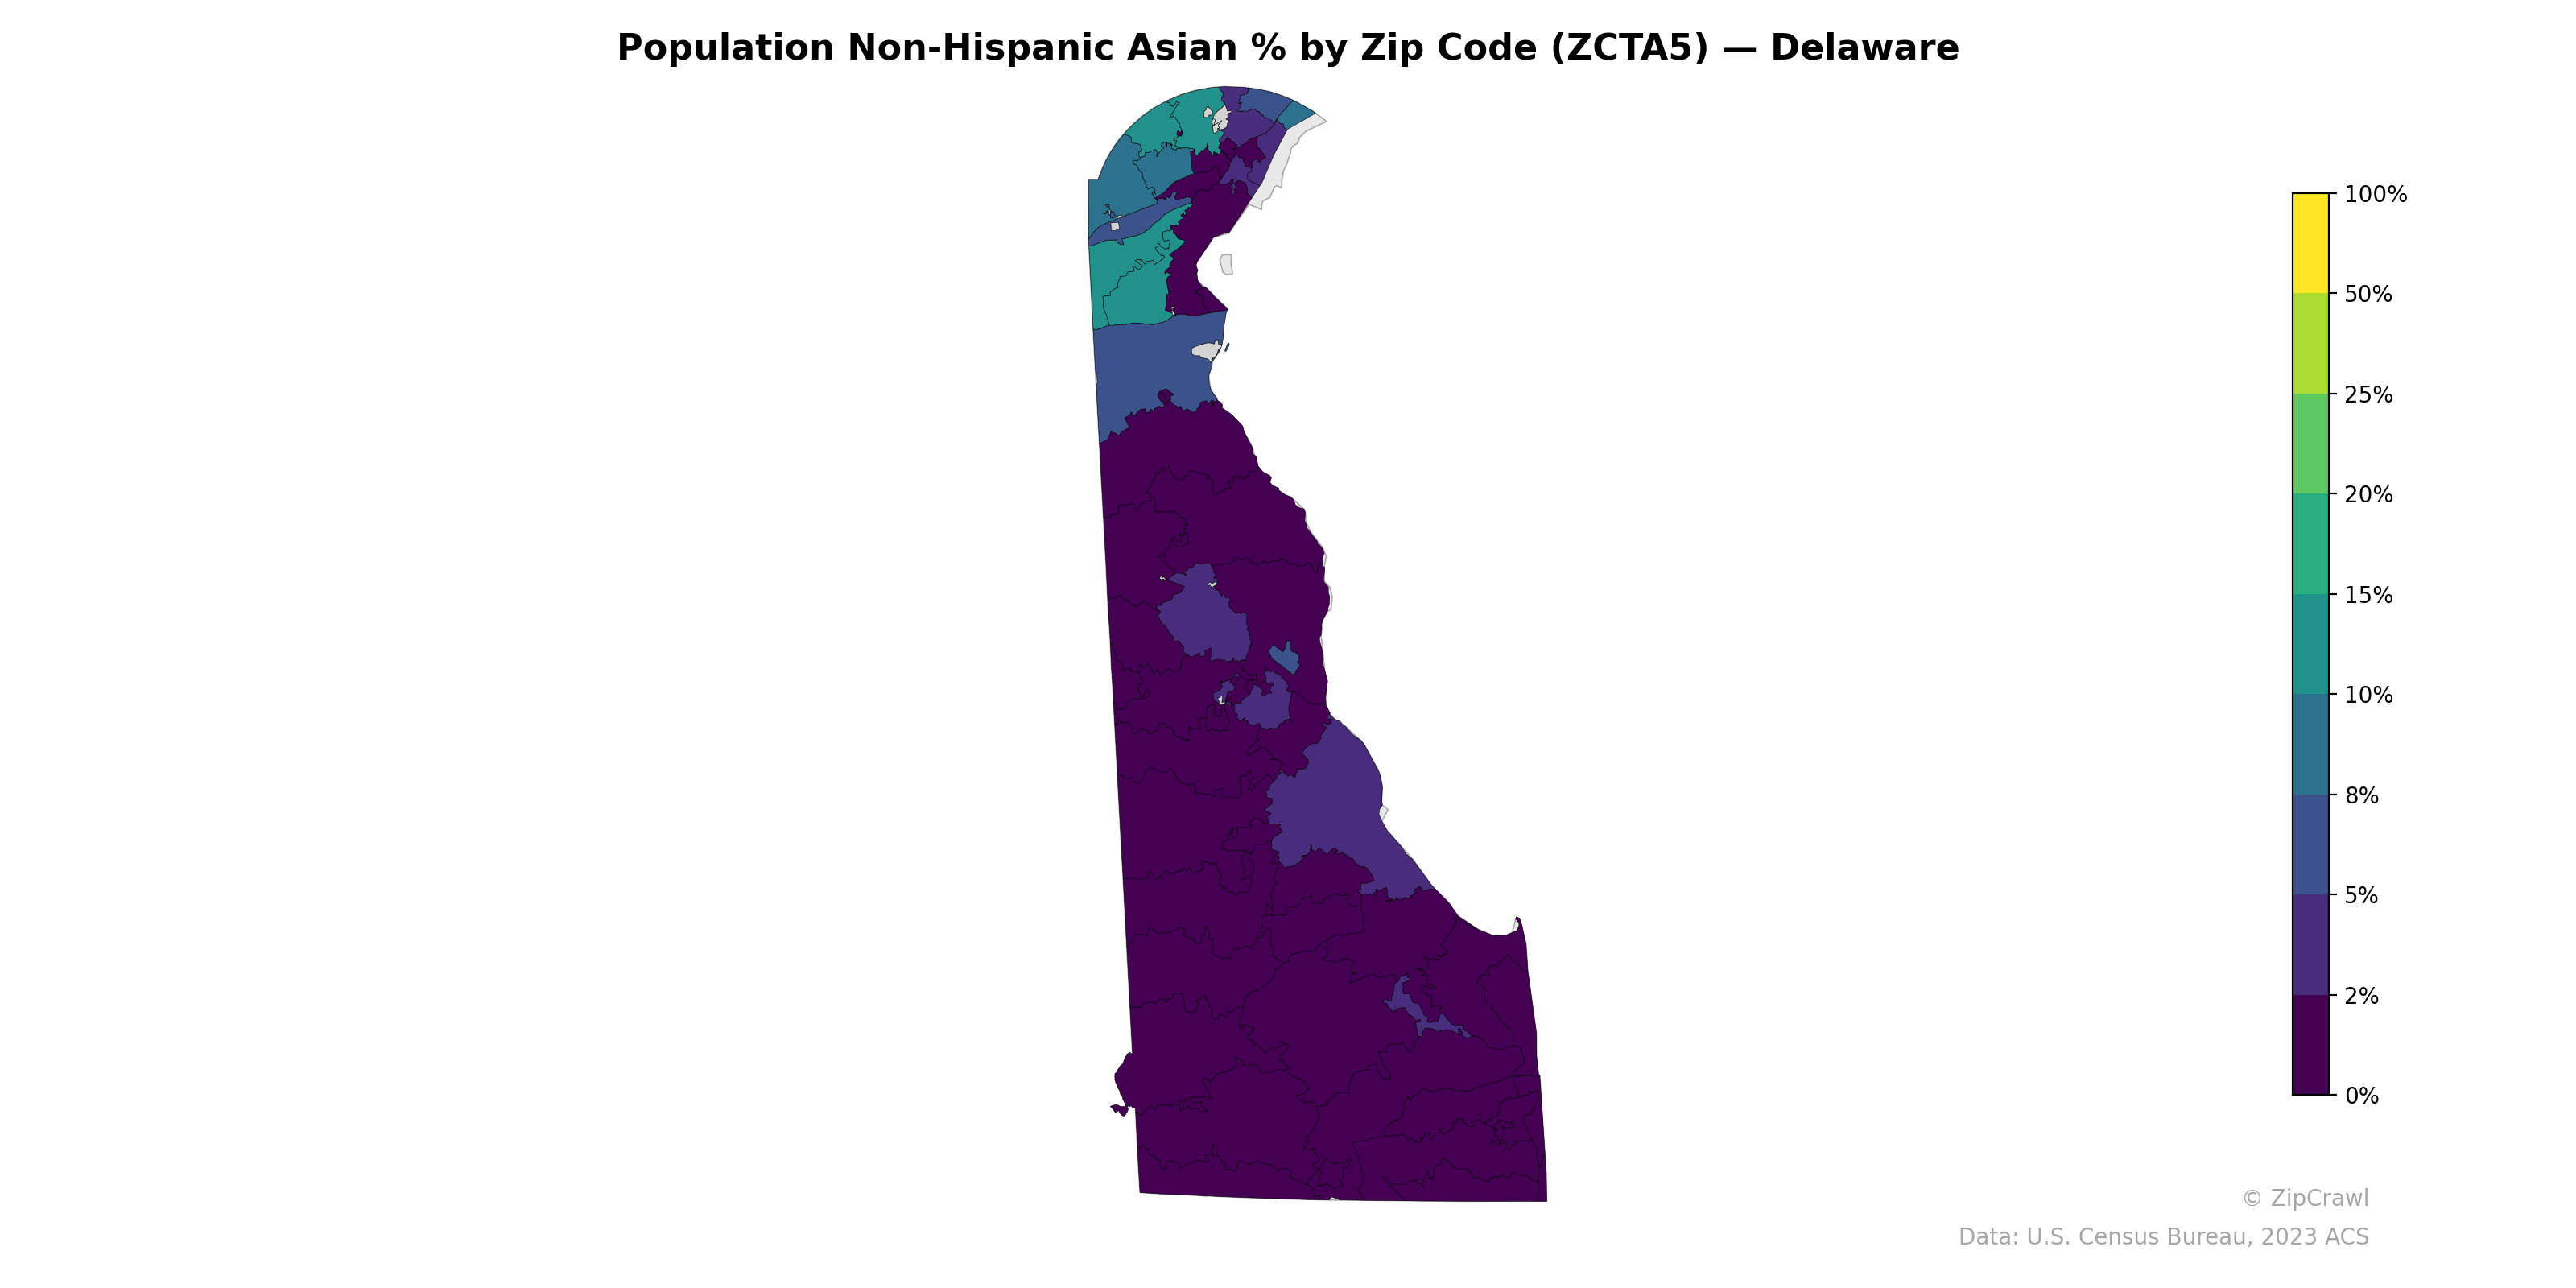
NOTE: Gray indicates insufficient data or a suppressed estimate.
Northern Delaware, particularly the zip codes in and around Wilmington and Newark in New Castle County, exhibits the highest concentrations of Non-Hispanic Asian residents, with several zip codes reaching 10–25% or higher, likely reflecting proximity to corporate employers, universities, and established immigrant communities. The contrast with southern Delaware is stark, as Kent and Sussex County zip codes overwhelmingly fall below 2%, with only a few scattered areas around Dover showing slightly elevated percentages in the 2–5% range. This north-south gradient underscores a demographic pattern where Asian population presence is heavily concentrated in the urbanized, economically diversified corridor of the state's northernmost county.
Data: U.S. Census Bureau, 2023 ACS
Explore
- Housing Owner-Occupied % of Units, by Zip Code (ZCTA5) — New York
- Population Hispanic % by Zip Code (ZCTA5) — South Dakota
- Population Non-Hispanic White % by Zip Code (ZCTA5) — South Dakota
- U.S. Citizens (% of Population Over 18) by Zip Code (ZCTA5) — South Dakota
- Population Non-Hispanic Black % by Zip Code (ZCTA5) — South Dakota
- Married Couple (% of all Households) by Zip Code (ZCTA5) — Delaware
- Median Age by Zip Code (ZCTA5) — South Dakota
- Housing Vacancy Rate by Zip Code (ZCTA5) — Delaware
- % of Population on Food Stamps or SNAP (Last 12 Months), by Zip Code (ZCTA5) — Delaware
- Household Median Income by Zip Code (ZCTA5) — South Dakota
- Household Average Size by County
- Married Couple (% of all Households) by Zip Code (ZCTA5) — New York
- % of Population without Health Insurance, by Zip Code (ZCTA5) — Massachusetts
- Housing % of Units Built Since 2010, by Zip Code (ZCTA5) — New York
- Household Average Size by Zip Code (ZCTA5) — New York
- % of Population without Health Insurance, by Zip Code (ZCTA5) — New York
- Housing Owner-Occupied Median Value ($), by Zip Code (ZCTA5) — New York
- % of Households with Broadband Internet, by Zip Code (ZCTA5) — New York
- Housing Vacancy Rate by Zip Code (ZCTA5) — New York
- % of Population without Health Insurance, by Zip Code (ZCTA5) — Florida
- Bachelor's Degree or Higher (% of Over 25) by Zip Code (ZCTA5) — New York
- Housing Median Monthly Rent ($), by Zip Code (ZCTA5) — New York
- Population Non-Hispanic American Indian % by Zip Code (ZCTA5) — Rhode Island
- High School Graduate (% of Over 25) by Zip Code (ZCTA5) — Rhode Island
- Married Couple (% of all Households) by Zip Code (ZCTA5) — Rhode Island
- Bachelor's Degree or Higher (% of Over 25) by Zip Code (ZCTA5) — Rhode Island
- Population Non-Hispanic American Indian % by Zip Code (ZCTA5) — North Dakota
- Housing Vacancy Rate by Zip Code (ZCTA5) — Alaska
- Population Non-Hispanic Black % by Zip Code (ZCTA5) — North Dakota
- Household Average Size by Zip Code (ZCTA5) — Rhode Island
- Population Non-Hispanic Asian % by Zip Code (ZCTA5) — Hawaii
- Population Non-Hispanic Asian % by Zip Code (ZCTA5) — Iowa
- Population Non-Hispanic Asian % by Zip Code (ZCTA5) — Ohio
- Population Non-Hispanic Asian % by Zip Code (ZCTA5) — Utah
- Population Non-Hispanic Asian % by Zip Code (ZCTA5) — Texas
- Population Non-Hispanic Asian % by Zip Code (ZCTA5) — Maine
- Population Non-Hispanic Asian % by Zip Code (ZCTA5) — Oregon
- Population Non-Hispanic Asian % by Zip Code (ZCTA5) — Nevada
- Population Non-Hispanic Asian % by Zip Code (ZCTA5) — Idaho
- Population Non-Hispanic Asian % by Zip Code (ZCTA5) — Alaska