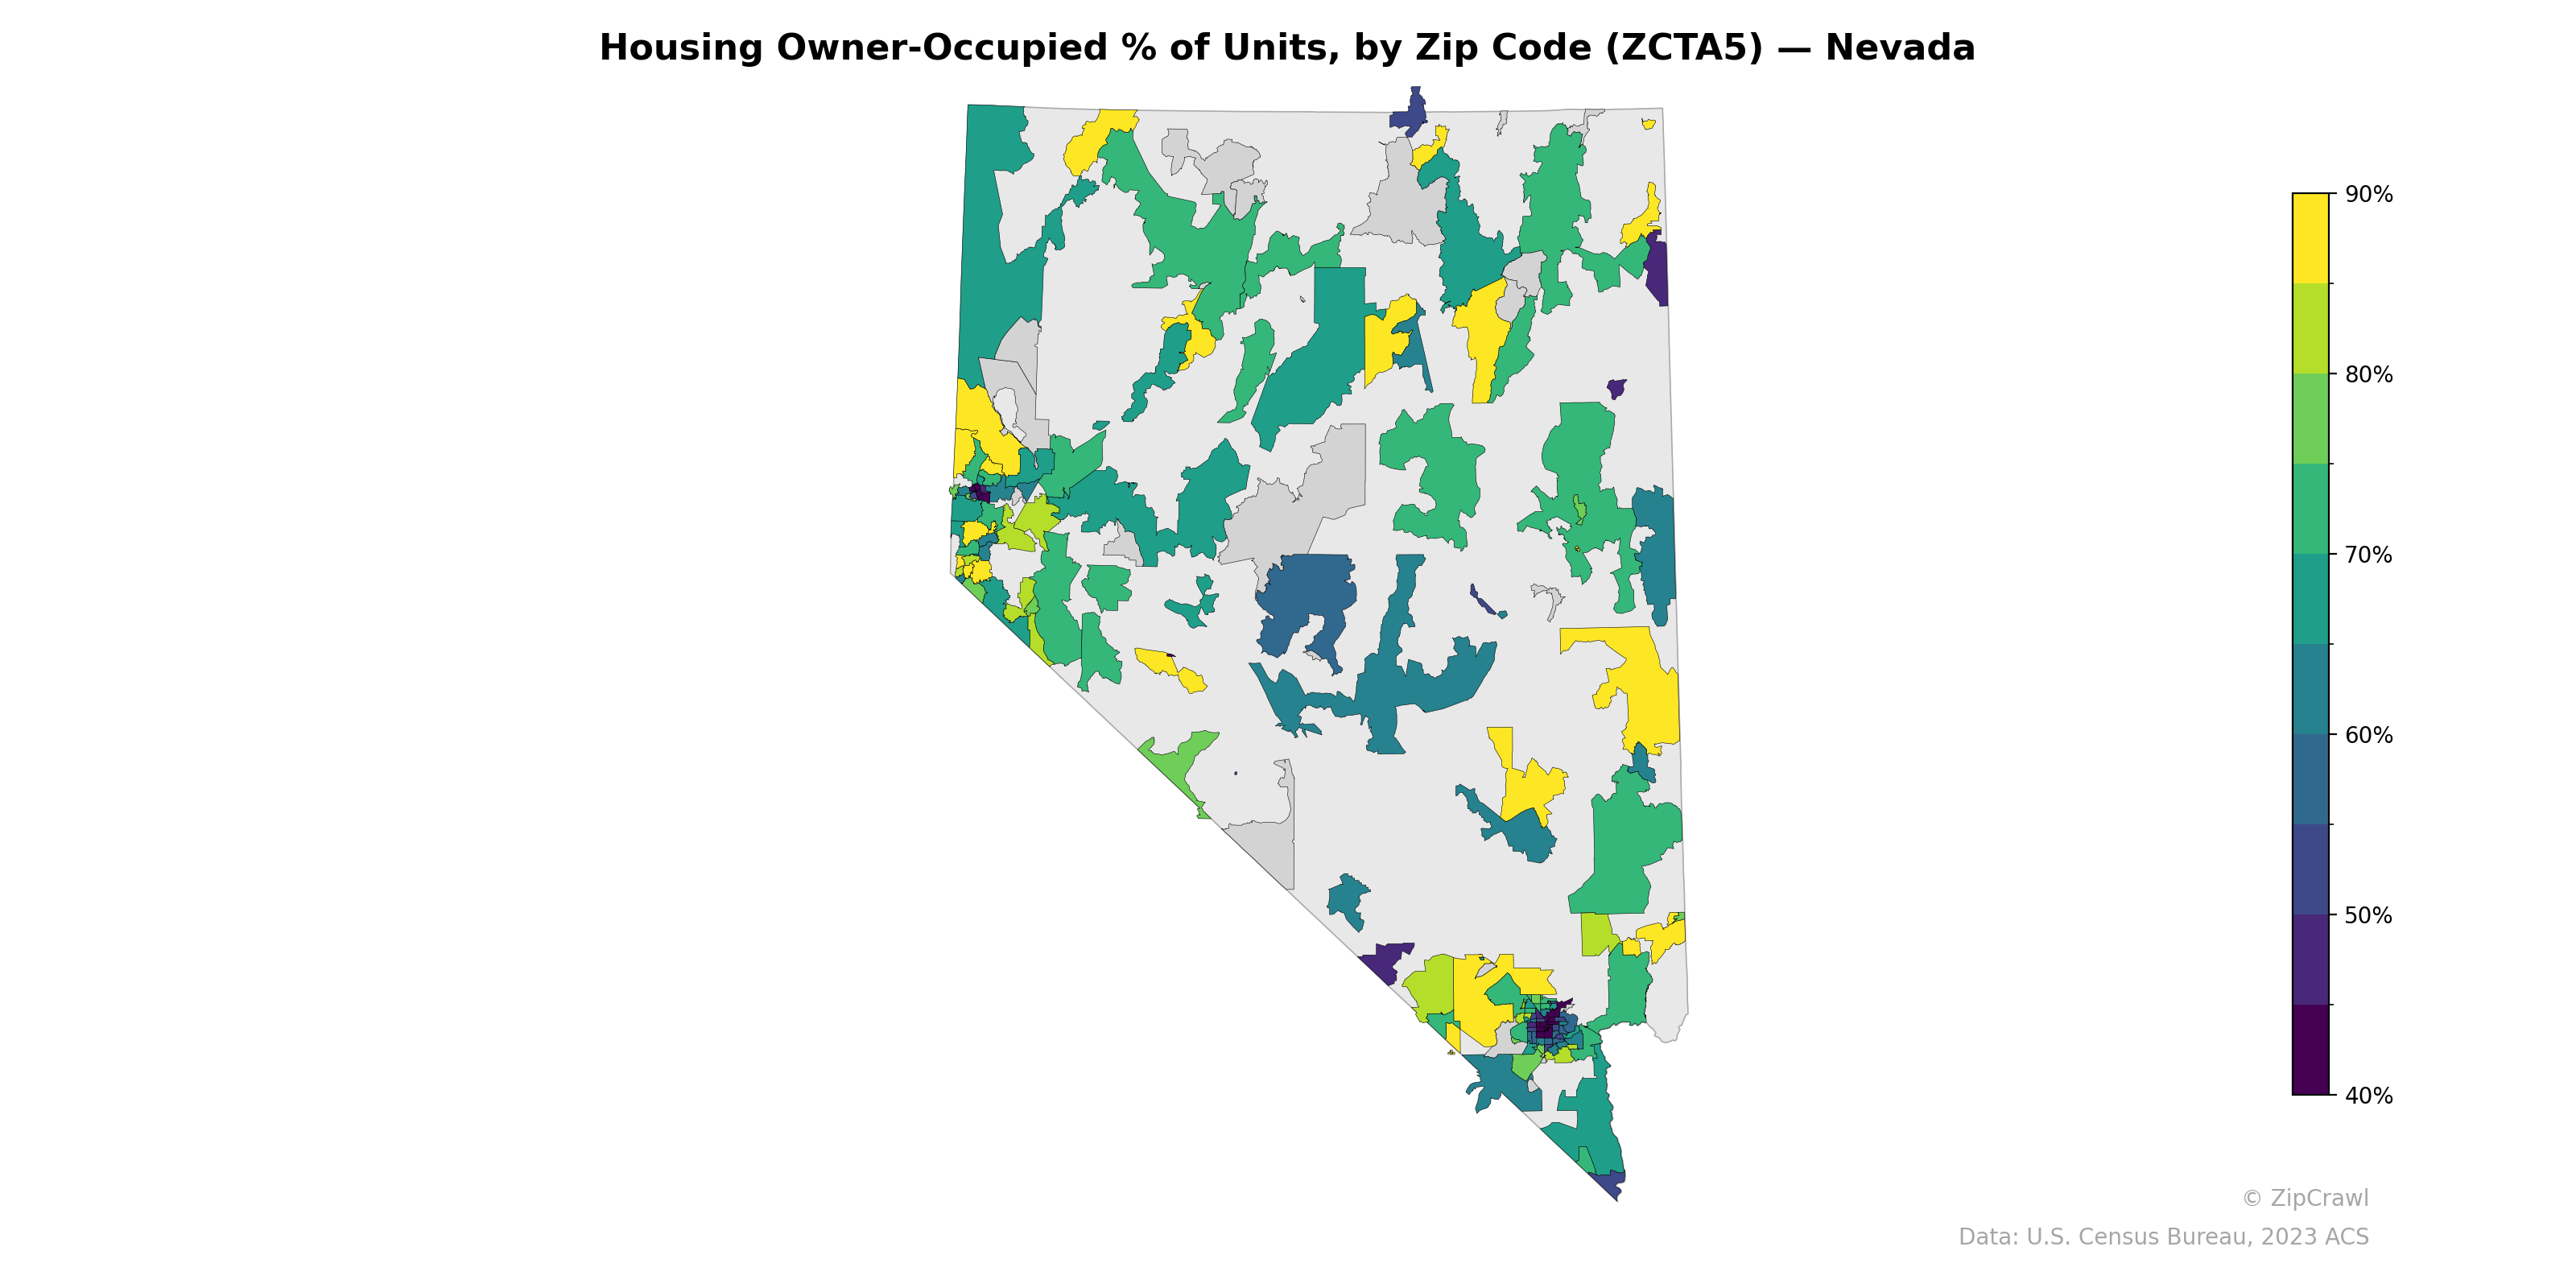
NOTE: Gray indicates insufficient data or a suppressed estimate.
Owner-occupancy rates across Nevada exhibit a clear urban-rural divide, with the Las Vegas metropolitan area in the southern tip displaying the lowest rates—several zip codes falling below 40%—reflecting the city's large renter-heavy multifamily housing stock. Rural zip codes across the northern and central portions of the state generally trend toward higher owner-occupancy rates in the 70–90% range, with notable yellow-shaded clusters in parts of northwestern Nevada near the Reno-Sparks periphery and scattered rural communities. The central-south region around Nye County shows a band of moderate-to-high ownership in teal tones, while a few isolated dark purple zip codes in both the Las Vegas core and the northeast corner represent pockets where rental housing significantly dominates.
Data: U.S. Census Bureau, 2023 ACS
Explore
- Population Hispanic % by Zip Code (ZCTA5) — Florida
- Housing % of Units Built Since 2010, by Zip Code (ZCTA5) — Nevada
- % of Population without Health Insurance, by Zip Code (ZCTA5) — Nevada
- Bachelor's Degree or Higher (% of Over 25) by Zip Code (ZCTA5) — Nevada
- Housing Owner-Occupied Median Value ($), by Zip Code (ZCTA5) — Nevada
- Household Average Size by Zip Code (ZCTA5) — Nevada
- Population Non-Hispanic American Indian % by Zip Code (ZCTA5) — Nevada
- % of Households with Broadband Internet, by Zip Code (ZCTA5) — Nevada
- Housing Median Monthly Rent ($), by Zip Code (ZCTA5) — Nevada
- High School Graduate (% of Over 25) by Zip Code (ZCTA5) — Nevada
- Housing Owner-Occupied Median Value ($), by County
- Population Non-Hispanic White % by Zip Code (ZCTA5) — Houston Metro
- High School Graduate (% of Over 25) by Zip Code (ZCTA5) — Florida
- Population Non-Hispanic White % by Zip Code (ZCTA5) — Illinois
- Population Non-Hispanic White % by Zip Code (ZCTA5) — Florida
- Median Age by Zip Code (ZCTA5) — Florida
- Population Non-Hispanic Black % by Zip Code (ZCTA5) — Florida
- Population Non-Hispanic Asian % by Zip Code (ZCTA5) — California
- % of Population on Food Stamps or SNAP (Last 12 Months), by Zip Code (ZCTA5) — California
- Household Median Income by Zip Code (ZCTA5) — Florida
- U.S. Citizens (% of Population Over 18) by Zip Code (ZCTA5) — Florida
- Population Non-Hispanic American Indian % by Zip Code (ZCTA5) — Florida
- Household Average Size by Zip Code (ZCTA5) — Connecticut
- Population Non-Hispanic American Indian % by Zip Code (ZCTA5) — Connecticut
- Married Couple (% of all Households) by Zip Code (ZCTA5) — Connecticut
- High School Graduate (% of Over 25) by Zip Code (ZCTA5) — Connecticut
- Population Hispanic % by Zip Code (ZCTA5) — Mississippi
- Household Median Income by Zip Code (ZCTA5) — Iowa
- Median Age by Zip Code (ZCTA5) — Iowa
- Housing Median Monthly Rent ($), by Zip Code (ZCTA5) — Connecticut
- Housing Owner-Occupied % of Units, by Zip Code (ZCTA5) — Ohio
- Housing Owner-Occupied % of Units, by Zip Code (ZCTA5) — Utah
- Housing Owner-Occupied % of Units, by Zip Code (ZCTA5) — New York
- Housing Owner-Occupied % of Units, by Zip Code (ZCTA5) — Nebraska
- Housing Owner-Occupied % of Units, by Zip Code (ZCTA5) — Iowa
- Housing Owner-Occupied % of Units, by Zip Code (ZCTA5) — Florida
- Housing Owner-Occupied % of Units, by Zip Code (ZCTA5) — Texas
- Housing Owner-Occupied % of Units, by Zip Code (ZCTA5) — Oregon
- Housing Owner-Occupied % of Units, by Zip Code (ZCTA5) — Idaho
- Housing Owner-Occupied % of Units, by Zip Code (ZCTA5) — Hawaii