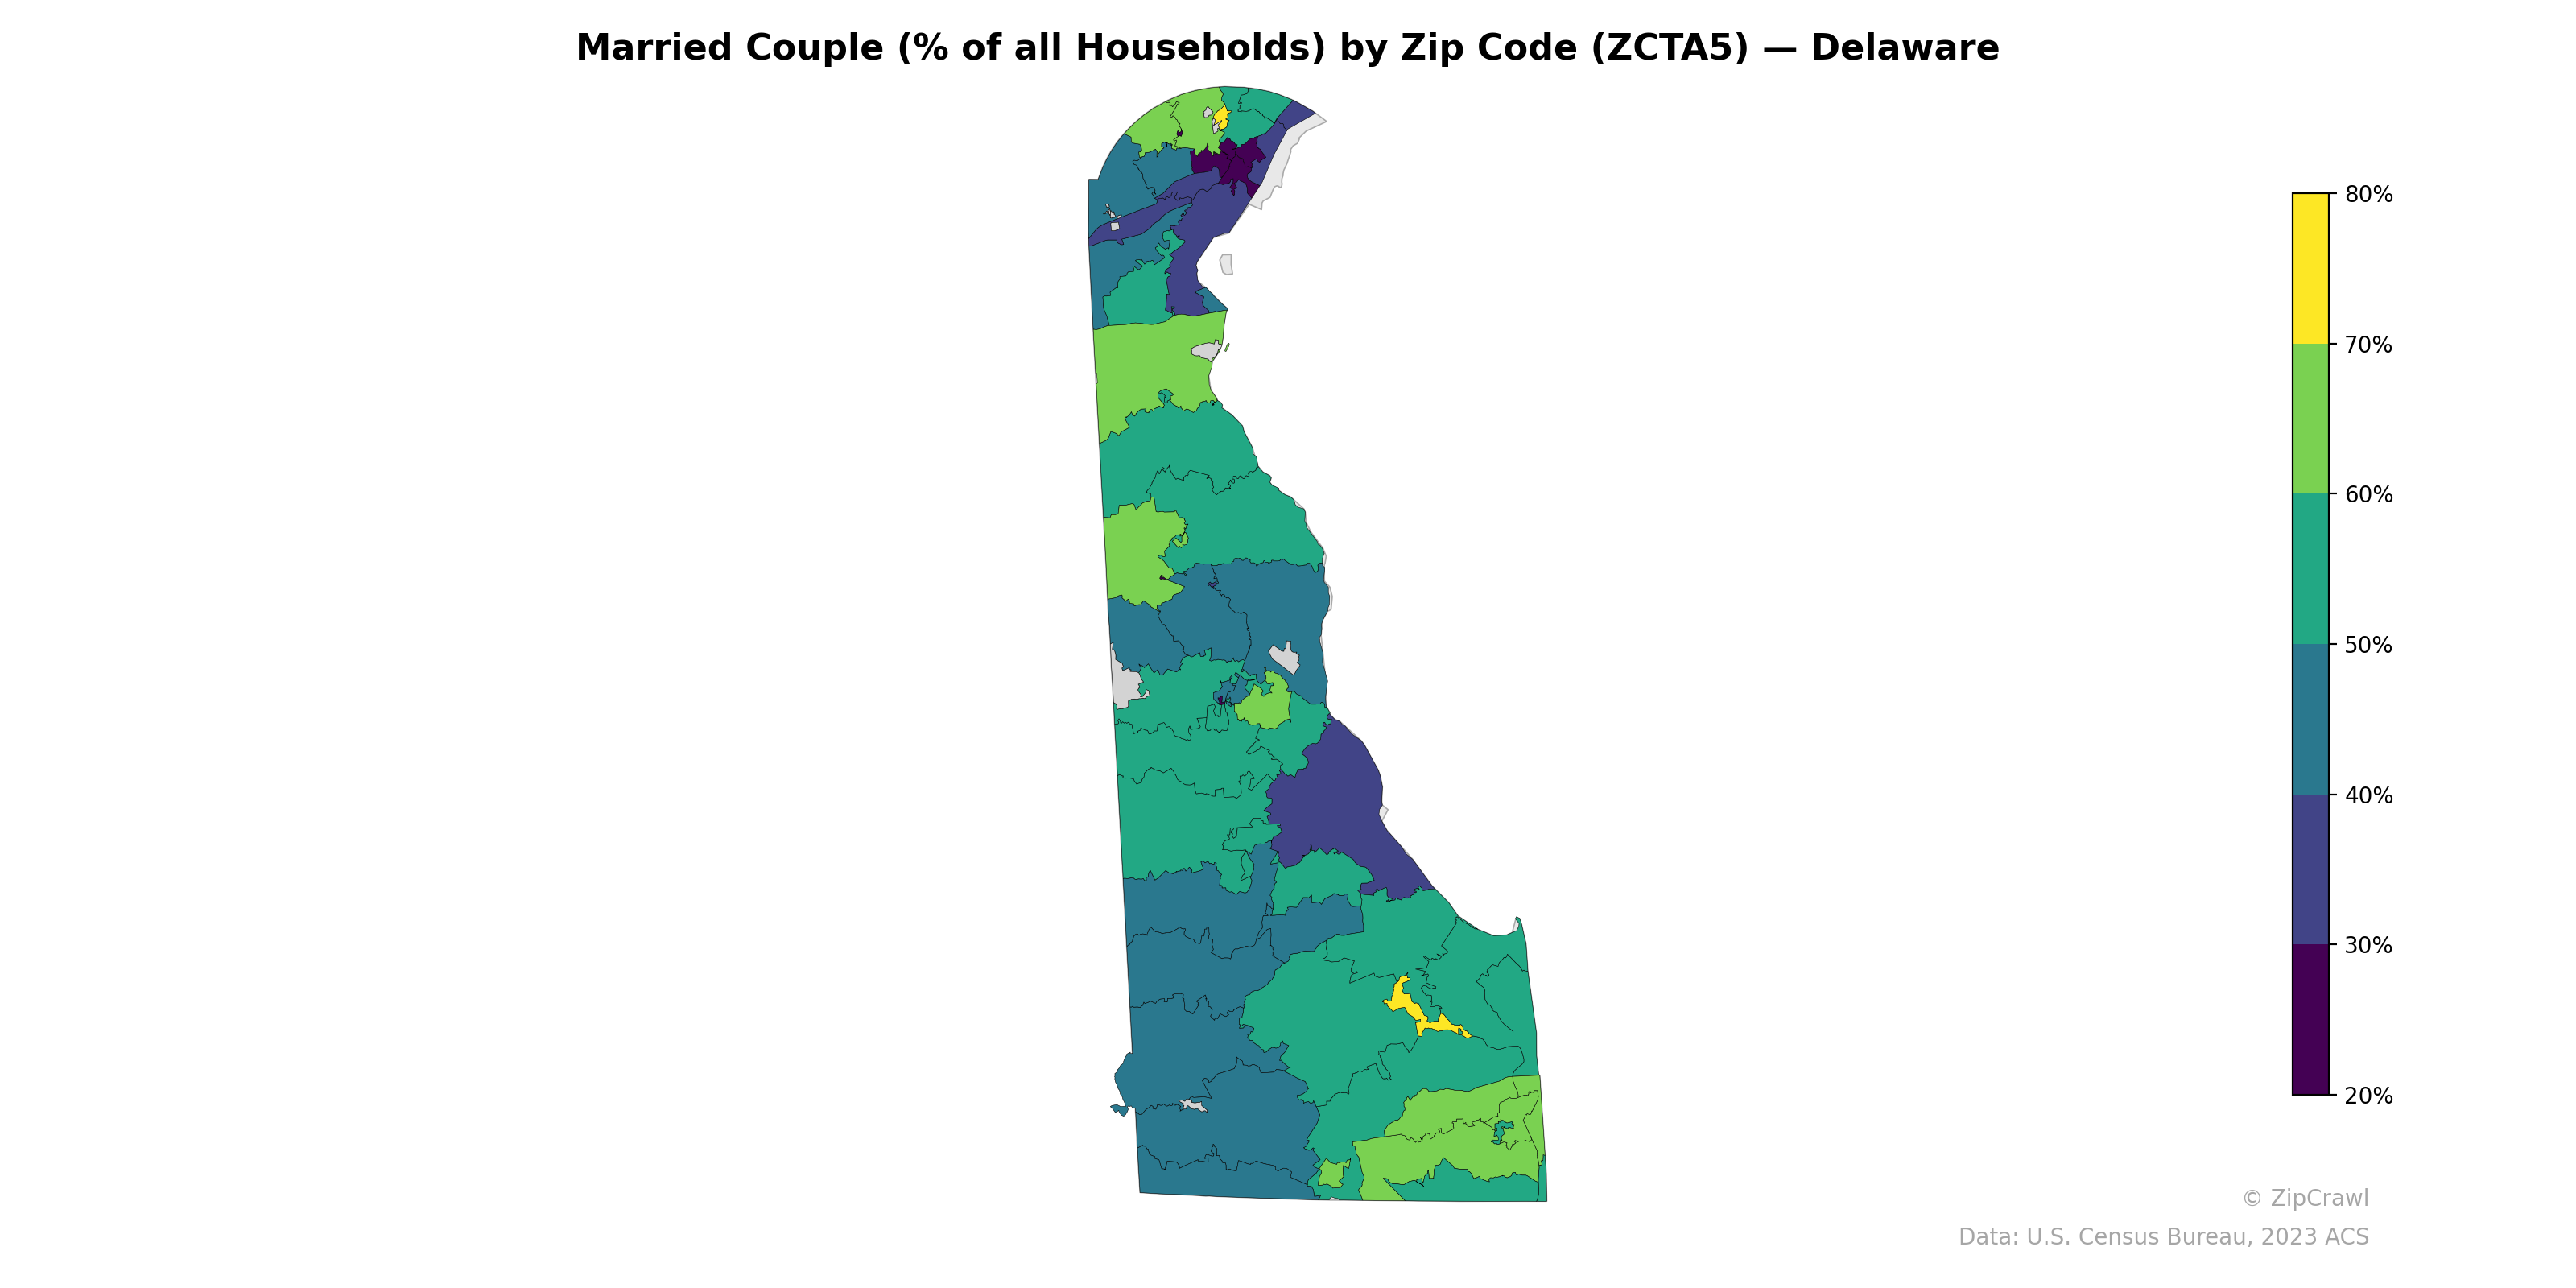
NOTE: Gray indicates insufficient data or a suppressed estimate.
Northern Delaware's urbanized areas around Wilmington display the lowest married-couple household rates, with several zip codes falling below 30%, reflecting the city's higher concentration of single-person and non-family households. Suburban zip codes ringing Wilmington and extending into central New Castle County exhibit markedly higher rates in the 60–80% range, creating a sharp urban-suburban gradient. Southern Delaware presents a more mixed pattern, with coastal and resort-area zip codes near Rehoboth Beach showing notably lower rates compared to the predominantly rural inland areas of Kent and Sussex counties, which generally cluster in the 50–65% range.
Data: U.S. Census Bureau, 2023 ACS
Explore
- Housing Owner-Occupied % of Units, by Zip Code (ZCTA5) — New York
- Household Median Income by Zip Code (ZCTA5) — South Dakota
- Population Non-Hispanic White % by Zip Code (ZCTA5) — South Dakota
- U.S. Citizens (% of Population Over 18) by Zip Code (ZCTA5) — South Dakota
- Population Non-Hispanic Black % by Zip Code (ZCTA5) — South Dakota
- Population Hispanic % by Zip Code (ZCTA5) — South Dakota
- Median Age by Zip Code (ZCTA5) — South Dakota
- % of Population on Food Stamps or SNAP (Last 12 Months), by Zip Code (ZCTA5) — Delaware
- Population Non-Hispanic Asian % by Zip Code (ZCTA5) — Delaware
- Housing Vacancy Rate by Zip Code (ZCTA5) — Delaware
- Household Average Size by County
- Bachelor's Degree or Higher (% of Over 25) by Zip Code (ZCTA5) — Massachusetts
- Housing % of Units Built Since 2010, by Zip Code (ZCTA5) — New York
- Household Average Size by Zip Code (ZCTA5) — New York
- % of Population without Health Insurance, by Zip Code (ZCTA5) — New York
- % of Households with Broadband Internet, by Zip Code (ZCTA5) — New York
- Housing Owner-Occupied Median Value ($), by Zip Code (ZCTA5) — New York
- Housing Vacancy Rate by Zip Code (ZCTA5) — New York
- Bachelor's Degree or Higher (% of Over 25) by Zip Code (ZCTA5) — Florida
- Bachelor's Degree or Higher (% of Over 25) by Zip Code (ZCTA5) — New York
- Housing Median Monthly Rent ($), by Zip Code (ZCTA5) — New York
- High School Graduate (% of Over 25) by Zip Code (ZCTA5) — Rhode Island
- Bachelor's Degree or Higher (% of Over 25) by Zip Code (ZCTA5) — Rhode Island
- Population Non-Hispanic Asian % by Zip Code (ZCTA5) — Rhode Island
- Population Non-Hispanic Black % by Zip Code (ZCTA5) — North Dakota
- % of Households with Broadband Internet, by Zip Code (ZCTA5) — Rhode Island
- Population Non-Hispanic American Indian % by Zip Code (ZCTA5) — Rhode Island
- Population Non-Hispanic American Indian % by Zip Code (ZCTA5) — North Dakota
- Housing Vacancy Rate by Zip Code (ZCTA5) — Alaska
- Housing Vacancy Rate by Zip Code (ZCTA5) — Rhode Island
- Married Couple (% of all Households) by Zip Code (ZCTA5) — Hawaii
- Married Couple (% of all Households) by Zip Code (ZCTA5) — Maine
- Married Couple (% of all Households) by Zip Code (ZCTA5) — Ohio
- Married Couple (% of all Households) by Zip Code (ZCTA5) — Iowa
- Married Couple (% of all Households) by Zip Code (ZCTA5) — Utah
- Married Couple (% of all Households) by Zip Code (ZCTA5) — Alaska
- Married Couple (% of all Households) by Zip Code (ZCTA5) — Alabama
- Married Couple (% of all Households) by Zip Code (ZCTA5) — Texas
- Married Couple (% of all Households) by Zip Code (ZCTA5) — Oregon
- Married Couple (% of all Households) by Zip Code (ZCTA5) — Maryland