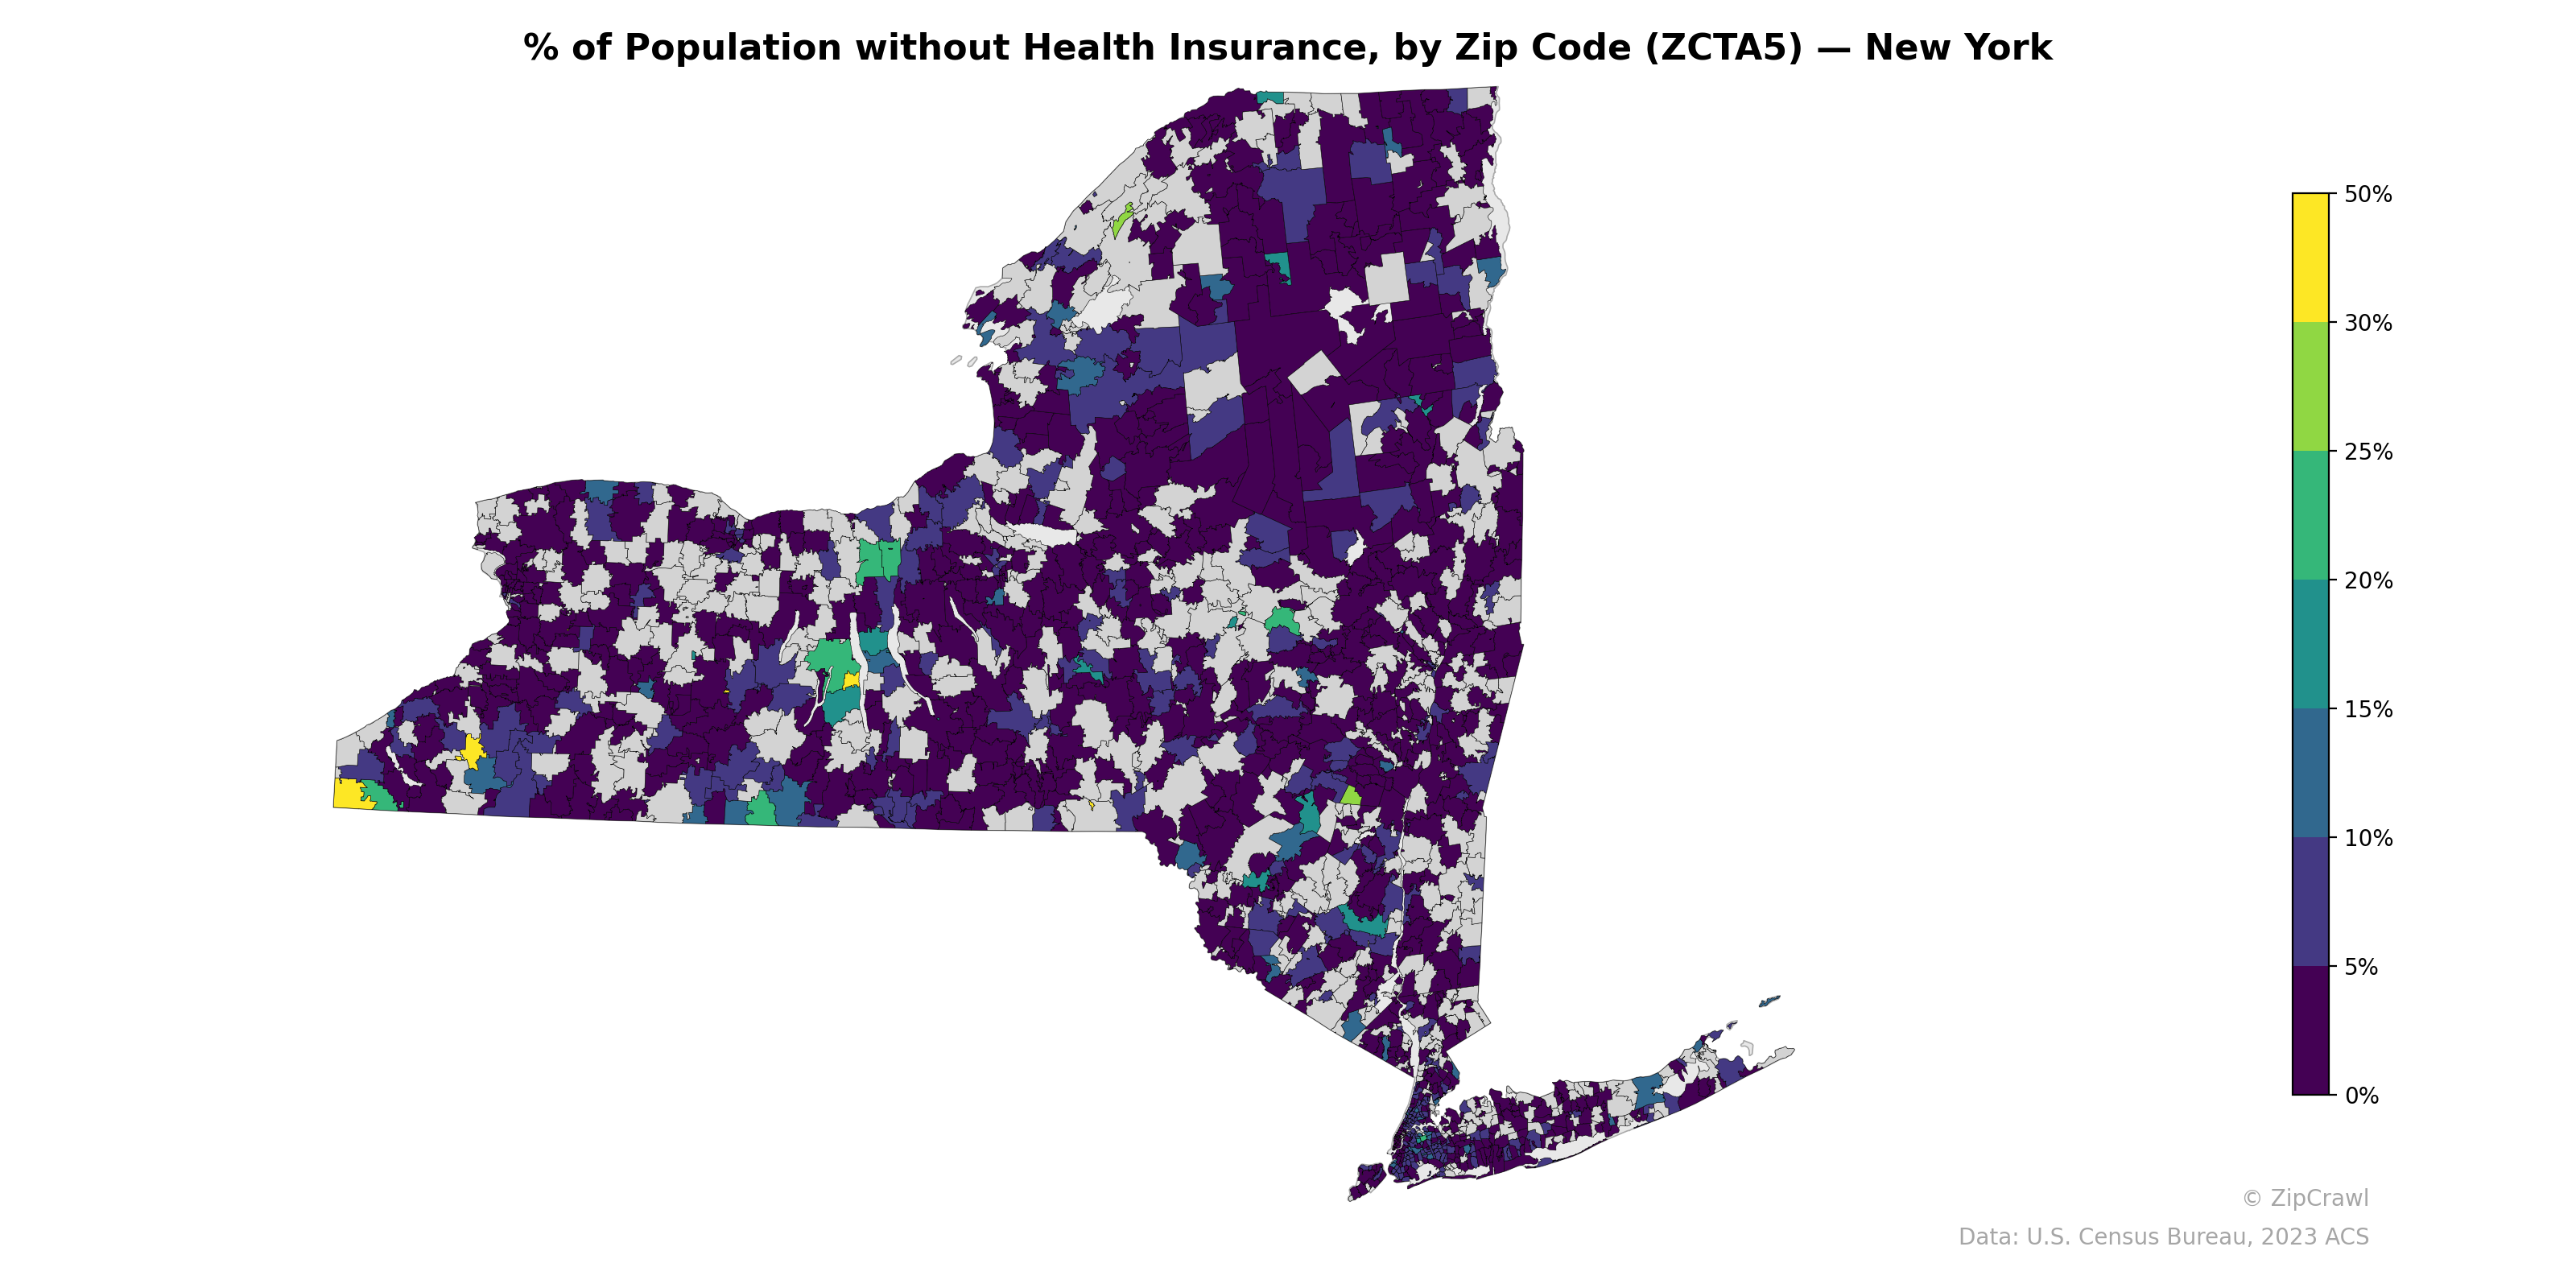
NOTE: Gray indicates insufficient data or a suppressed estimate.
Uninsured rates across New York State are predominantly low, with most zip codes falling below 10%, though notable concentrations of higher uninsured populations (15–25%+) cluster in parts of New York City's outer boroughs, particularly in the Bronx and Queens, as well as in scattered rural zip codes in the Southern Tier and western border regions near Chautauqua County. The Adirondack region and much of the Hudson Valley display consistently low uninsured rates, while upstate urban centers like Syracuse, Albany, and Rochester show modest elevations surrounded by lower-rate suburban zip codes. Long Island presents a mixed pattern, with pockets of elevated uninsured percentages interspersed among generally well-insured communities, likely reflecting disparities tied to immigrant populations and income variation.
Data: U.S. Census Bureau, 2023 ACS
Explore
- Housing % of Units Built Since 2010, by Zip Code (ZCTA5) — Delaware
- Population Non-Hispanic Asian % by Zip Code (ZCTA5) — South Dakota
- High School Graduate (% of Over 25) by Zip Code (ZCTA5) — Delaware
- Population Non-Hispanic American Indian % by Zip Code (ZCTA5) — Delaware
- Housing Owner-Occupied % of Units, by Zip Code (ZCTA5) — Delaware
- Household Average Size by Zip Code (ZCTA5) — Delaware
- Housing Median Monthly Rent ($), by Zip Code (ZCTA5) — Delaware
- Housing Owner-Occupied Median Value ($), by Zip Code (ZCTA5) — Delaware
- Bachelor's Degree or Higher (% of Over 25) by Zip Code (ZCTA5) — Delaware
- % of Households with Broadband Internet, by Zip Code (ZCTA5) — Delaware
- Household Average Size by County
- Housing Owner-Occupied Median Value ($), by Zip Code (ZCTA5) — New York
- Married Couple (% of all Households) by Zip Code (ZCTA5) — New York
- Housing Median Monthly Rent ($), by Zip Code (ZCTA5) — New York
- Housing Owner-Occupied % of Units, by Zip Code (ZCTA5) — New York
- Housing % of Units Built Since 2010, by Zip Code (ZCTA5) — New York
- Housing Vacancy Rate by Zip Code (ZCTA5) — New York
- Bachelor's Degree or Higher (% of Over 25) by Zip Code (ZCTA5) — New York
- Household Average Size by Zip Code (ZCTA5) — New York
- % of Households with Broadband Internet, by Zip Code (ZCTA5) — New York
- Population Non-Hispanic Asian % by Zip Code (ZCTA5) — New Hampshire
- Population Non-Hispanic American Indian % by Zip Code (ZCTA5) — Rhode Island
- Married Couple (% of all Households) by Zip Code (ZCTA5) — Rhode Island
- Population Non-Hispanic Asian % by Zip Code (ZCTA5) — Iowa
- Population Non-Hispanic Black % by Zip Code (ZCTA5) — North Dakota
- High School Graduate (% of Over 25) by Zip Code (ZCTA5) — Rhode Island
- Population Non-Hispanic American Indian % by Zip Code (ZCTA5) — North Dakota
- Population Non-Hispanic Asian % by Zip Code (ZCTA5) — New Mexico
- Population Non-Hispanic Asian % by Zip Code (ZCTA5) — Kentucky
- Housing Vacancy Rate by Zip Code (ZCTA5) — Alaska
- % of Population without Health Insurance, by Zip Code (ZCTA5) — New York Metro
- % of Population without Health Insurance, by Zip Code (ZCTA5) — New Jersey
- % of Population without Health Insurance, by Zip Code (ZCTA5) — New Mexico
- % of Population without Health Insurance, by Zip Code (ZCTA5) — Nevada
- % of Population without Health Insurance, by Zip Code (ZCTA5) — Ohio
- % of Population without Health Insurance, by Zip Code (ZCTA5) — Iowa
- % of Population without Health Insurance, by Zip Code (ZCTA5) — New Hampshire
- % of Population without Health Insurance, by Zip Code (ZCTA5) — Nebraska
- % of Population without Health Insurance, by Zip Code (ZCTA5) — Utah
- % of Population without Health Insurance, by Zip Code (ZCTA5) — Oregon