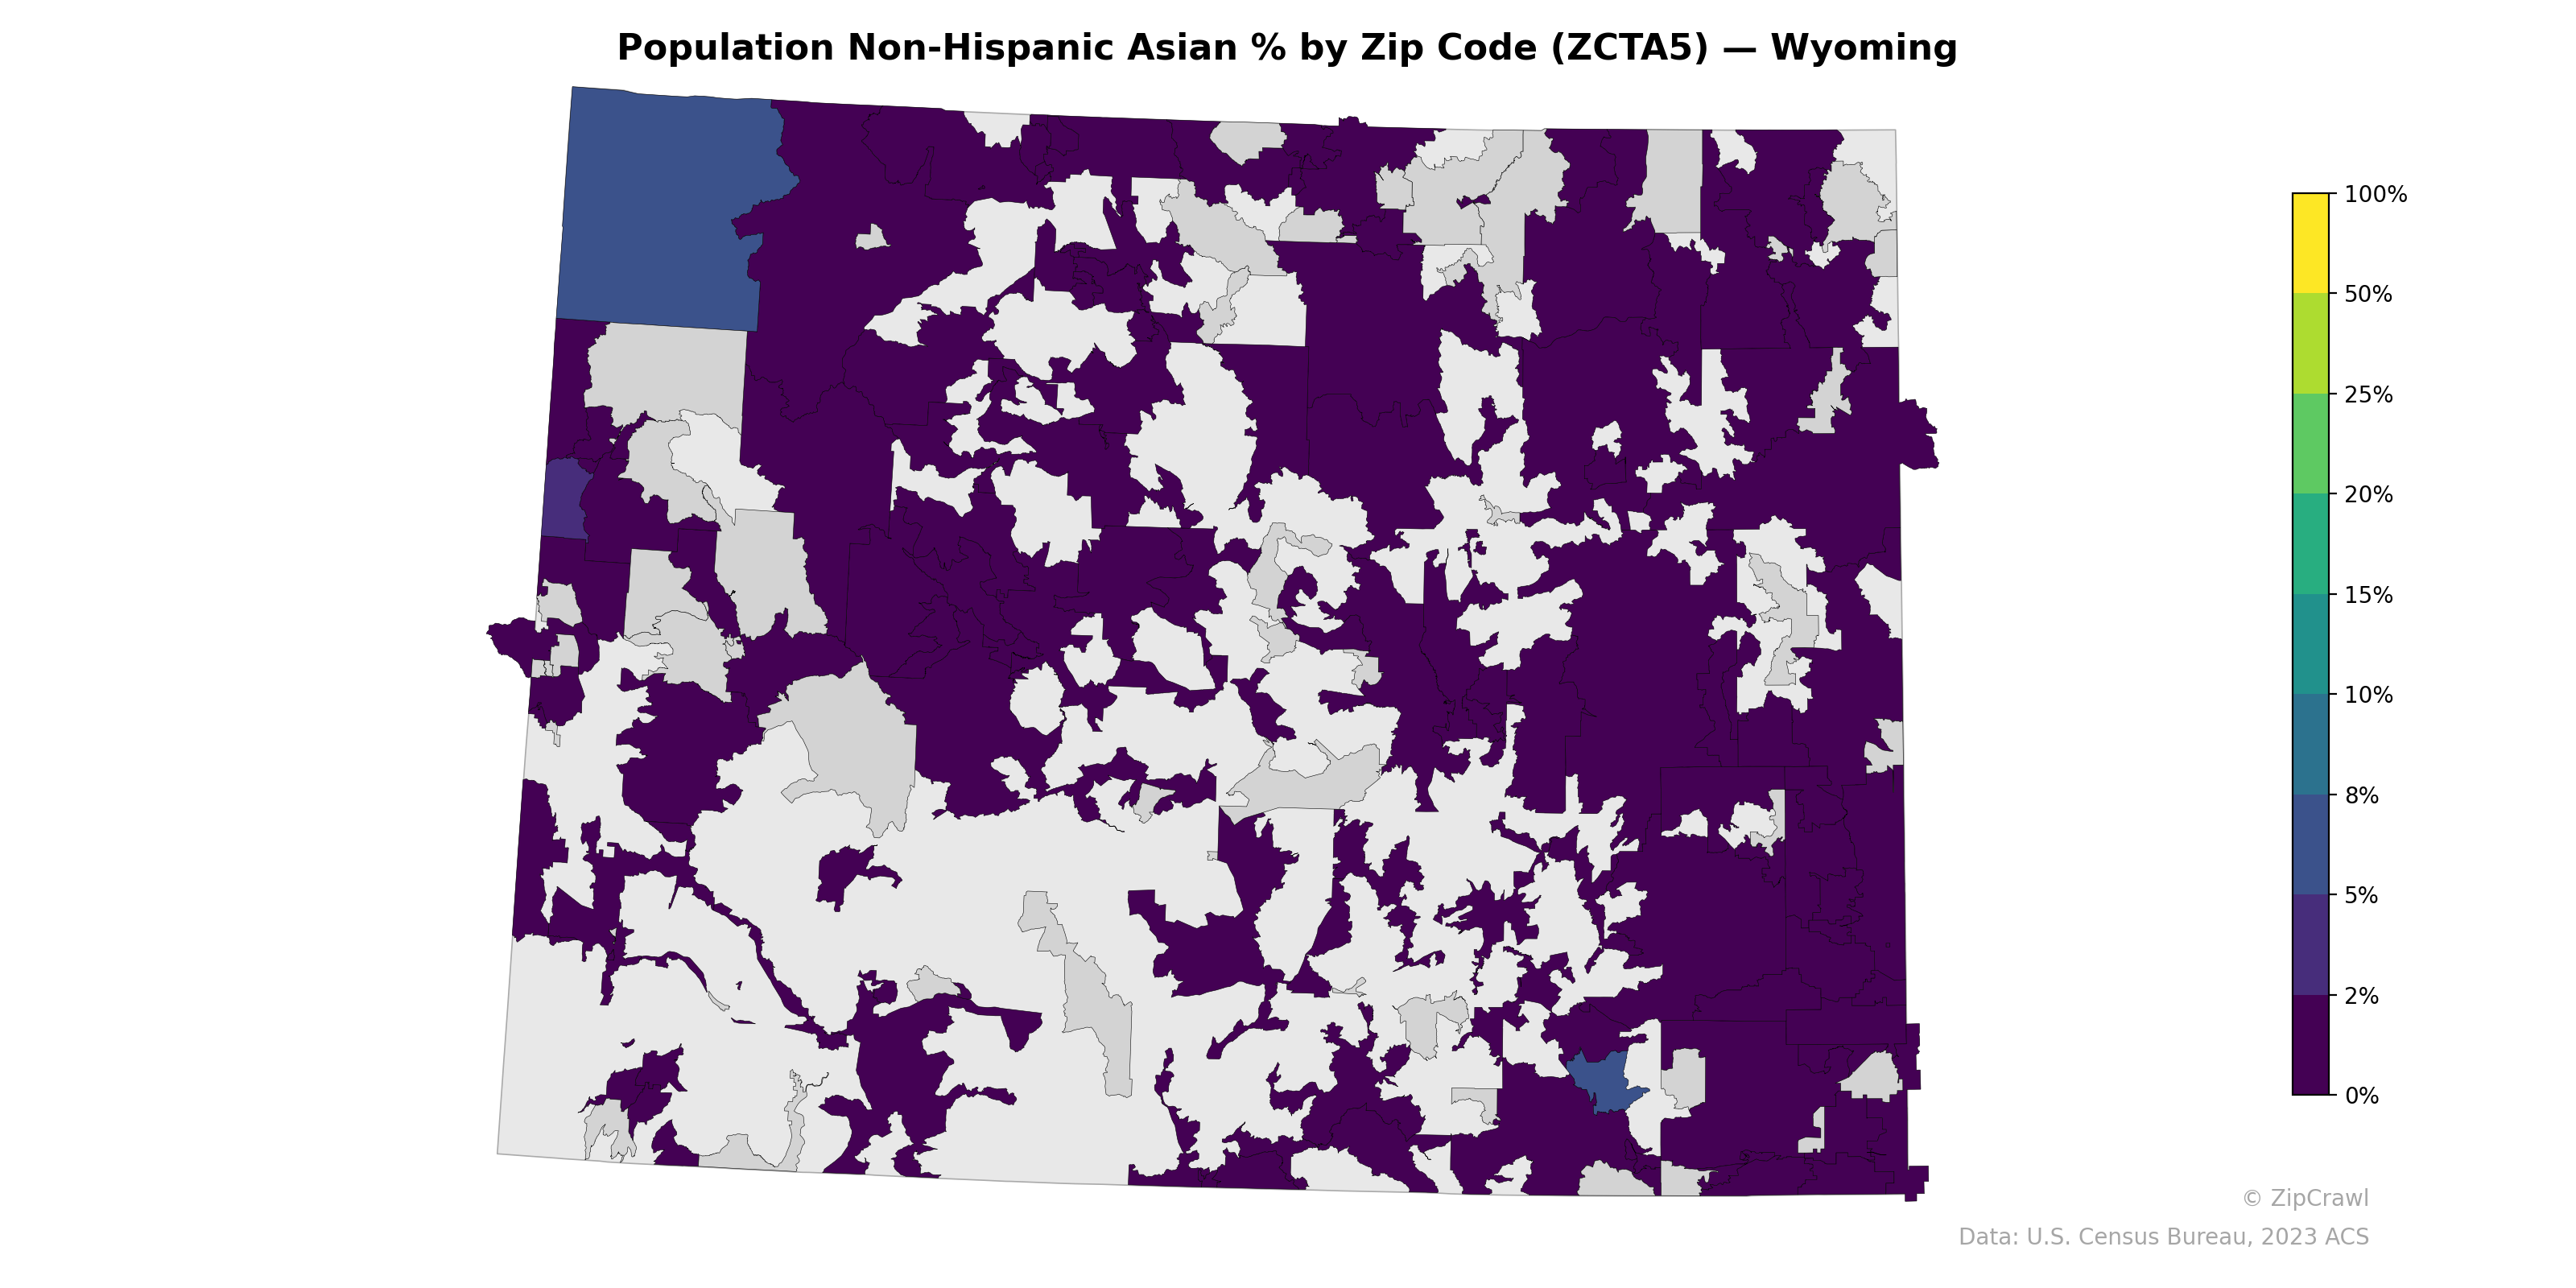
NOTE: Gray indicates insufficient data or a suppressed estimate.
Wyoming's Non-Hispanic Asian population percentages are uniformly low across nearly all zip codes, with the vast majority falling below 2%, reflecting the state's limited Asian demographic presence. The northwest corner—likely encompassing the Teton Village/Jackson area—stands out as the only notable concentration with slightly elevated percentages in the 2–5% range, consistent with resort and service-economy employment patterns. A small cluster in the southeast, near the Cheyenne/Laramie corridor, also registers marginally higher values compared to the predominant near-zero levels across the state's rural interior.
Data: U.S. Census Bureau, 2023 ACS
Explore
- Household Median Income by Zip Code (ZCTA5) — Illinois
- Population Hispanic % by Zip Code (ZCTA5) — Washington D.C.
- Married Couple (% of all Households) by Zip Code (ZCTA5) — Wyoming
- Housing Vacancy Rate by Zip Code (ZCTA5) — Wyoming
- Population Non-Hispanic Black % by Zip Code (ZCTA5) — Washington D.C.
- Population Non-Hispanic White % by Zip Code (ZCTA5) — Washington D.C.
- Household Median Income by Zip Code (ZCTA5) — Washington D.C.
- U.S. Citizens (% of Population Over 18) by Zip Code (ZCTA5) — Washington D.C.
- % of Population on Food Stamps or SNAP (Last 12 Months), by Zip Code (ZCTA5) — Wyoming
- Median Age by Zip Code (ZCTA5) — Washington D.C.
- Married Couple (% of all Households) by County
- % of Population without Health Insurance, by Zip Code (ZCTA5) — San Francisco Metro
- Population Non-Hispanic American Indian % by Zip Code (ZCTA5) — Illinois
- High School Graduate (% of Over 25) by Zip Code (ZCTA5) — Illinois
- % of Population without Health Insurance, by Zip Code (ZCTA5) — Florida
- Population Non-Hispanic White % by Zip Code (ZCTA5) — Illinois
- Population Hispanic % by Zip Code (ZCTA5) — Illinois
- Median Age by Zip Code (ZCTA5) — Illinois
- % of Population on Food Stamps or SNAP (Last 12 Months), by Zip Code (ZCTA5) — New York
- U.S. Citizens (% of Population Over 18) by Zip Code (ZCTA5) — Illinois
- Population Non-Hispanic Black % by Zip Code (ZCTA5) — Illinois
- Housing Vacancy Rate by Zip Code (ZCTA5) — Vermont
- % of Households with Broadband Internet, by Zip Code (ZCTA5) — Vermont
- % of Population on Food Stamps or SNAP (Last 12 Months), by Zip Code (ZCTA5) — Vermont
- % of Population without Health Insurance, by Zip Code (ZCTA5) — Vermont
- % of Households with Broadband Internet, by Zip Code (ZCTA5) — Oregon
- Population Non-Hispanic American Indian % by Zip Code (ZCTA5) — Vermont
- High School Graduate (% of Over 25) by Zip Code (ZCTA5) — Vermont
- Bachelor's Degree or Higher (% of Over 25) by Zip Code (ZCTA5) — Vermont
- Married Couple (% of all Households) by Zip Code (ZCTA5) — Vermont
- Population Non-Hispanic Asian % by Zip Code (ZCTA5) — Utah
- Population Non-Hispanic Asian % by Zip Code (ZCTA5) — Iowa
- Population Non-Hispanic Asian % by Zip Code (ZCTA5) — Ohio
- Population Non-Hispanic Asian % by Zip Code (ZCTA5) — Washington
- Population Non-Hispanic Asian % by Zip Code (ZCTA5) — Texas
- Population Non-Hispanic Asian % by Zip Code (ZCTA5) — Hawaii
- Population Non-Hispanic Asian % by Zip Code (ZCTA5) — Oregon
- Population Non-Hispanic Asian % by Zip Code (ZCTA5) — Nevada
- Population Non-Hispanic Asian % by Zip Code (ZCTA5) — Idaho
- Population Non-Hispanic Asian % by Zip Code (ZCTA5) — Maine