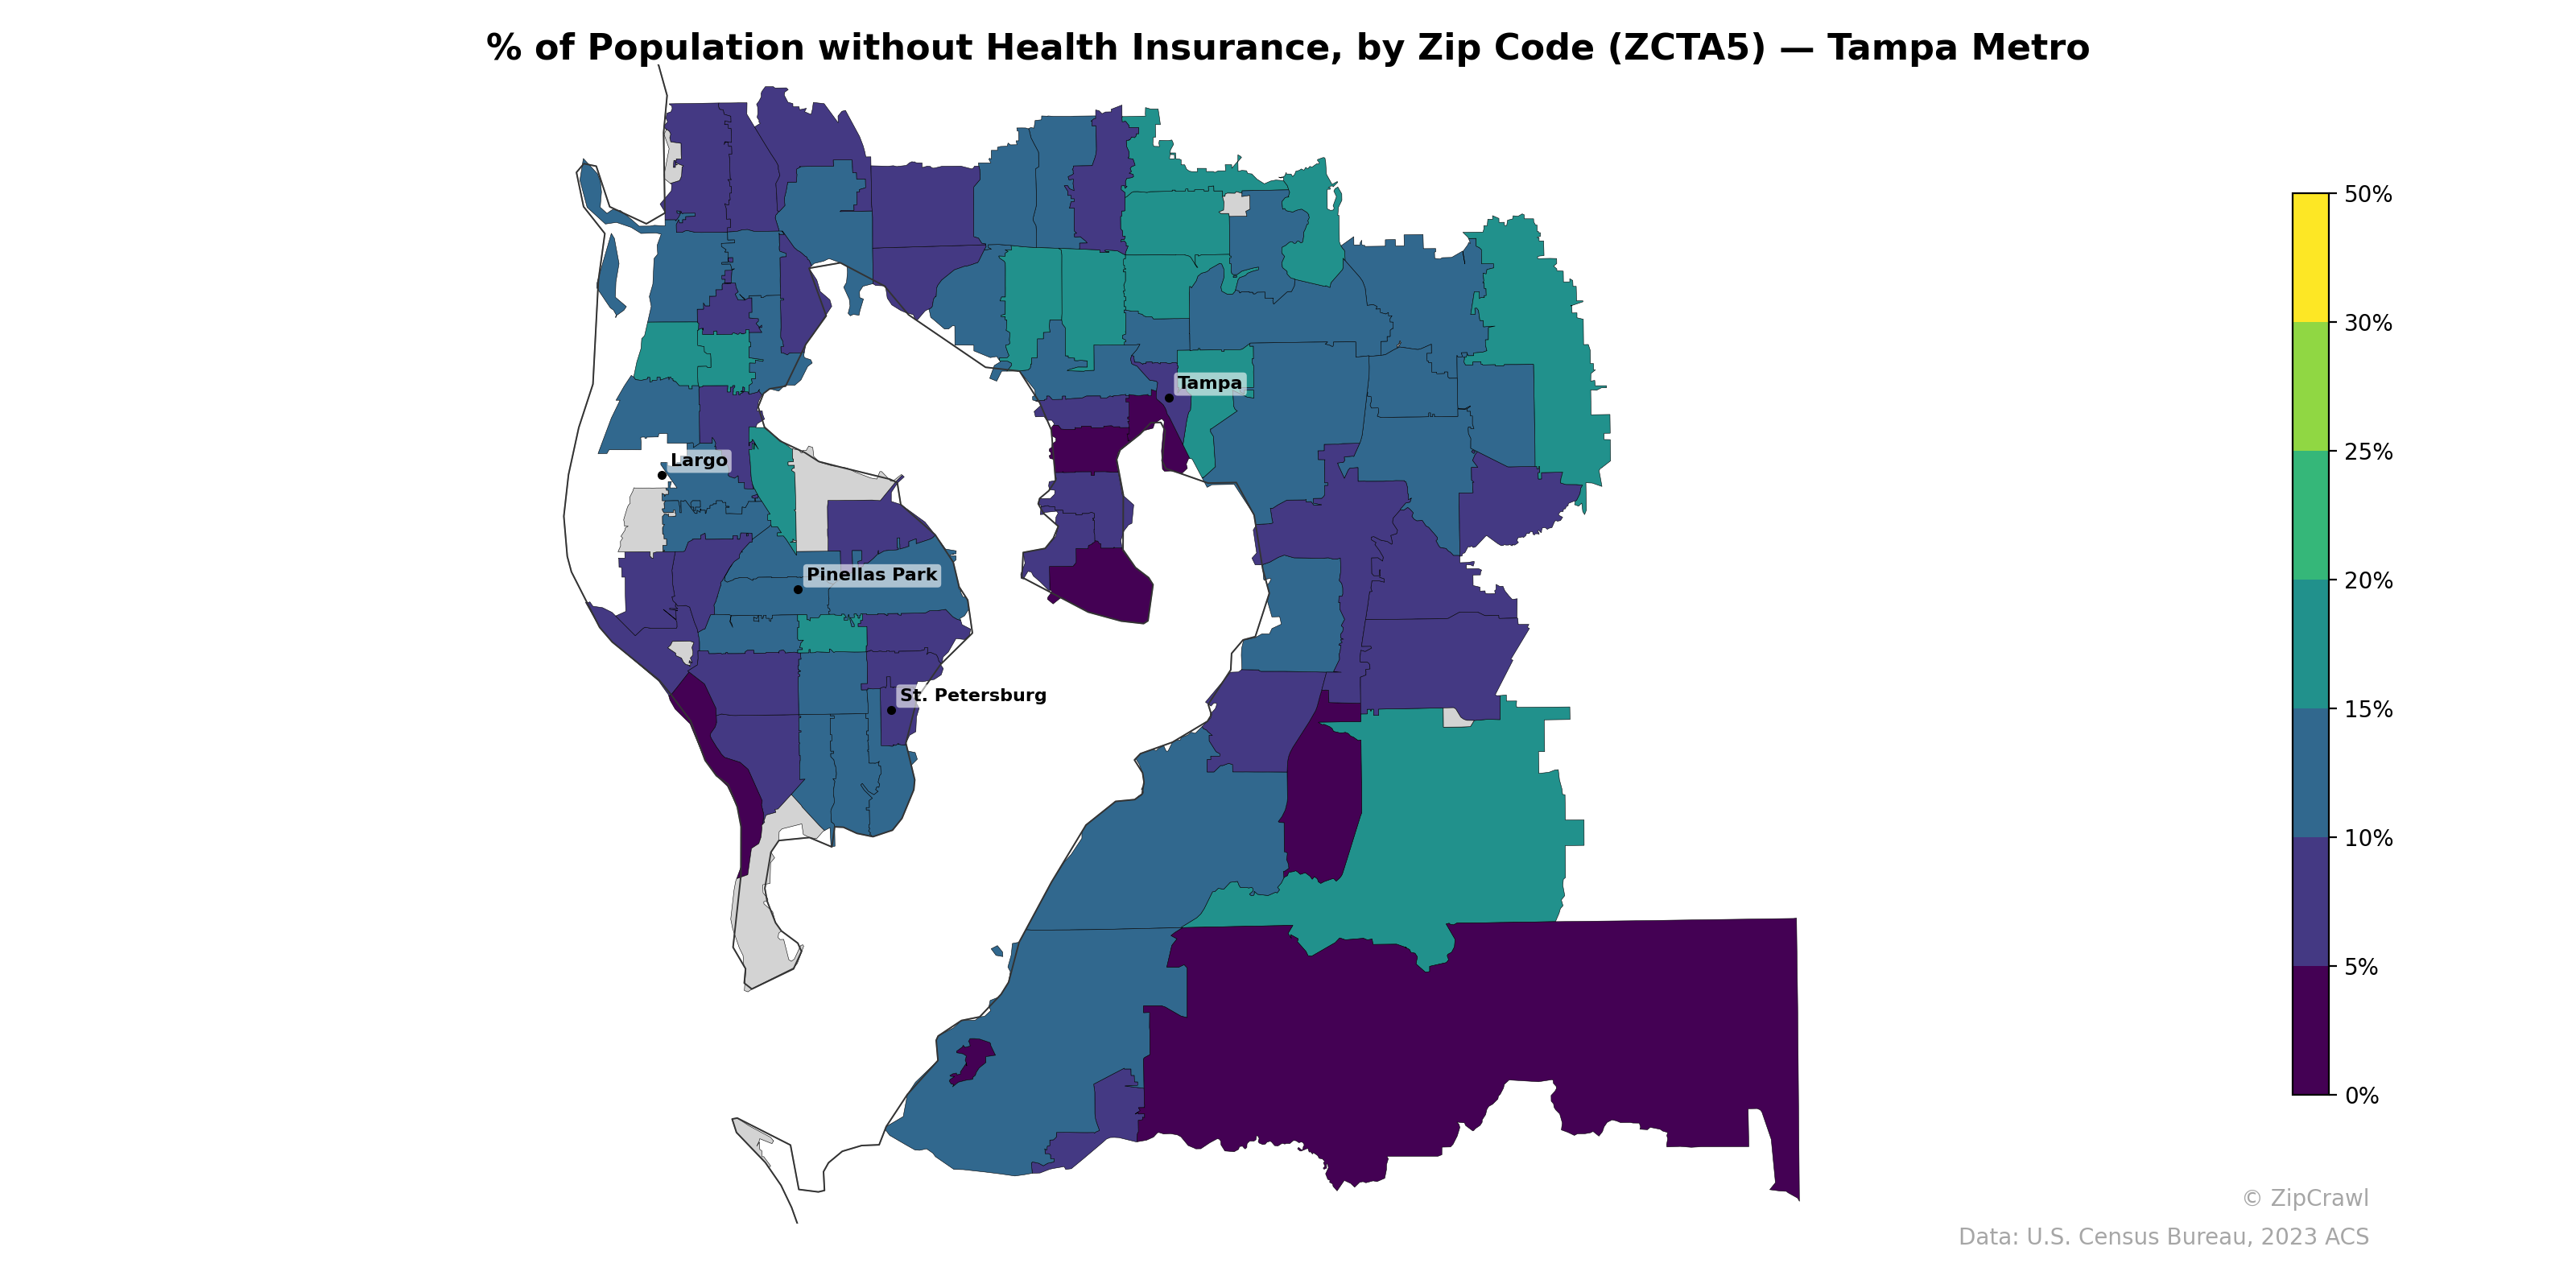
NOTE: Gray indicates insufficient data or a suppressed estimate.
Uninsured rates in the Tampa metro area exhibit a clear urban-suburban divide, with the highest concentrations—exceeding 25-30%—clustered in zip codes just north and east of downtown Tampa, as well as in parts of southern Pinellas County near St. Petersburg's urban core. In contrast, coastal and suburban zip codes along the western Pinellas beaches, the far southeastern portions of the metro, and several northern exurban areas tend to report rates below 10%. The Largo and Pinellas Park corridor displays notably lower uninsured rates compared to adjacent zip codes, suggesting localized differences in employer-sponsored coverage or demographic composition.
Data: U.S. Census Bureau, 2023 ACS
Explore
- % of Households with Broadband Internet, by Zip Code (ZCTA5) — Chicago Metro
- Housing Vacancy Rate by Zip Code (ZCTA5) — Tampa Metro
- Housing Median Monthly Rent ($), by Zip Code (ZCTA5) — Tampa Metro
- Married Couple (% of all Households) by Zip Code (ZCTA5) — Tampa Metro
- Housing Owner-Occupied % of Units, by Zip Code (ZCTA5) — Tampa Metro
- % of Households with Broadband Internet, by Zip Code (ZCTA5) — Tampa Metro
- Housing % of Units Built Since 2010, by Zip Code (ZCTA5) — Tampa Metro
- Housing Owner-Occupied Median Value ($), by Zip Code (ZCTA5) — Tampa Metro
- Bachelor's Degree or Higher (% of Over 25) by Zip Code (ZCTA5) — Tampa Metro
- Household Average Size by Zip Code (ZCTA5) — Tampa Metro
- Population Non-Hispanic American Indian % by County
- Housing Owner-Occupied Median Value ($), by County
- Housing Vacancy Rate by Zip Code (ZCTA5) — Chicago Metro
- Housing Median Monthly Rent ($), by Zip Code (ZCTA5) — Chicago Metro
- Married Couple (% of all Households) by Zip Code (ZCTA5) — Chicago Metro
- Bachelor's Degree or Higher (% of Over 25) by Zip Code (ZCTA5) — Chicago Metro
- Housing Owner-Occupied % of Units, by Zip Code (ZCTA5) — Chicago Metro
- Housing Owner-Occupied Median Value ($), by Zip Code (ZCTA5) — Chicago Metro
- Housing % of Units Built Since 2010, by Zip Code (ZCTA5) — Chicago Metro
- Household Average Size by Zip Code (ZCTA5) — Chicago Metro
- Housing % of Units Built Since 2010, by Zip Code (ZCTA5) — Denver Metro
- Housing Owner-Occupied % of Units, by Zip Code (ZCTA5) — Denver Metro
- Household Average Size by Zip Code (ZCTA5) — Denver Metro
- Population Non-Hispanic American Indian % by Zip Code (ZCTA5) — Denver Metro
- Population Non-Hispanic Black % by Zip Code (ZCTA5) — Denver Metro
- High School Graduate (% of Over 25) by Zip Code (ZCTA5) — Denver Metro
- Population Non-Hispanic White % by Zip Code (ZCTA5) — Denver Metro
- % of Households with Broadband Internet, by Zip Code (ZCTA5) — Denver Metro
- Housing Owner-Occupied Median Value ($), by Zip Code (ZCTA5) — Denver Metro
- Population Hispanic % by Zip Code (ZCTA5) — Denver Metro
- % of Population without Health Insurance, by Zip Code (ZCTA5) — Boston Metro
- % of Population without Health Insurance, by Zip Code (ZCTA5) — Houston Metro
- % of Population without Health Insurance, by Zip Code (ZCTA5) — Miami Metro
- % of Population without Health Insurance, by Zip Code (ZCTA5) — Detroit Metro
- % of Population without Health Insurance, by Zip Code (ZCTA5) — Denver Metro
- % of Population without Health Insurance, by Zip Code (ZCTA5) — Chicago Metro
- % of Population without Health Insurance, by Zip Code (ZCTA5) — Orlando Metro
- % of Population without Health Insurance, by Zip Code (ZCTA5) — Dallas Metro
- % of Population without Health Insurance, by Zip Code (ZCTA5) — Phoenix Metro
- % of Population without Health Insurance, by Zip Code (ZCTA5) — Austin Metro