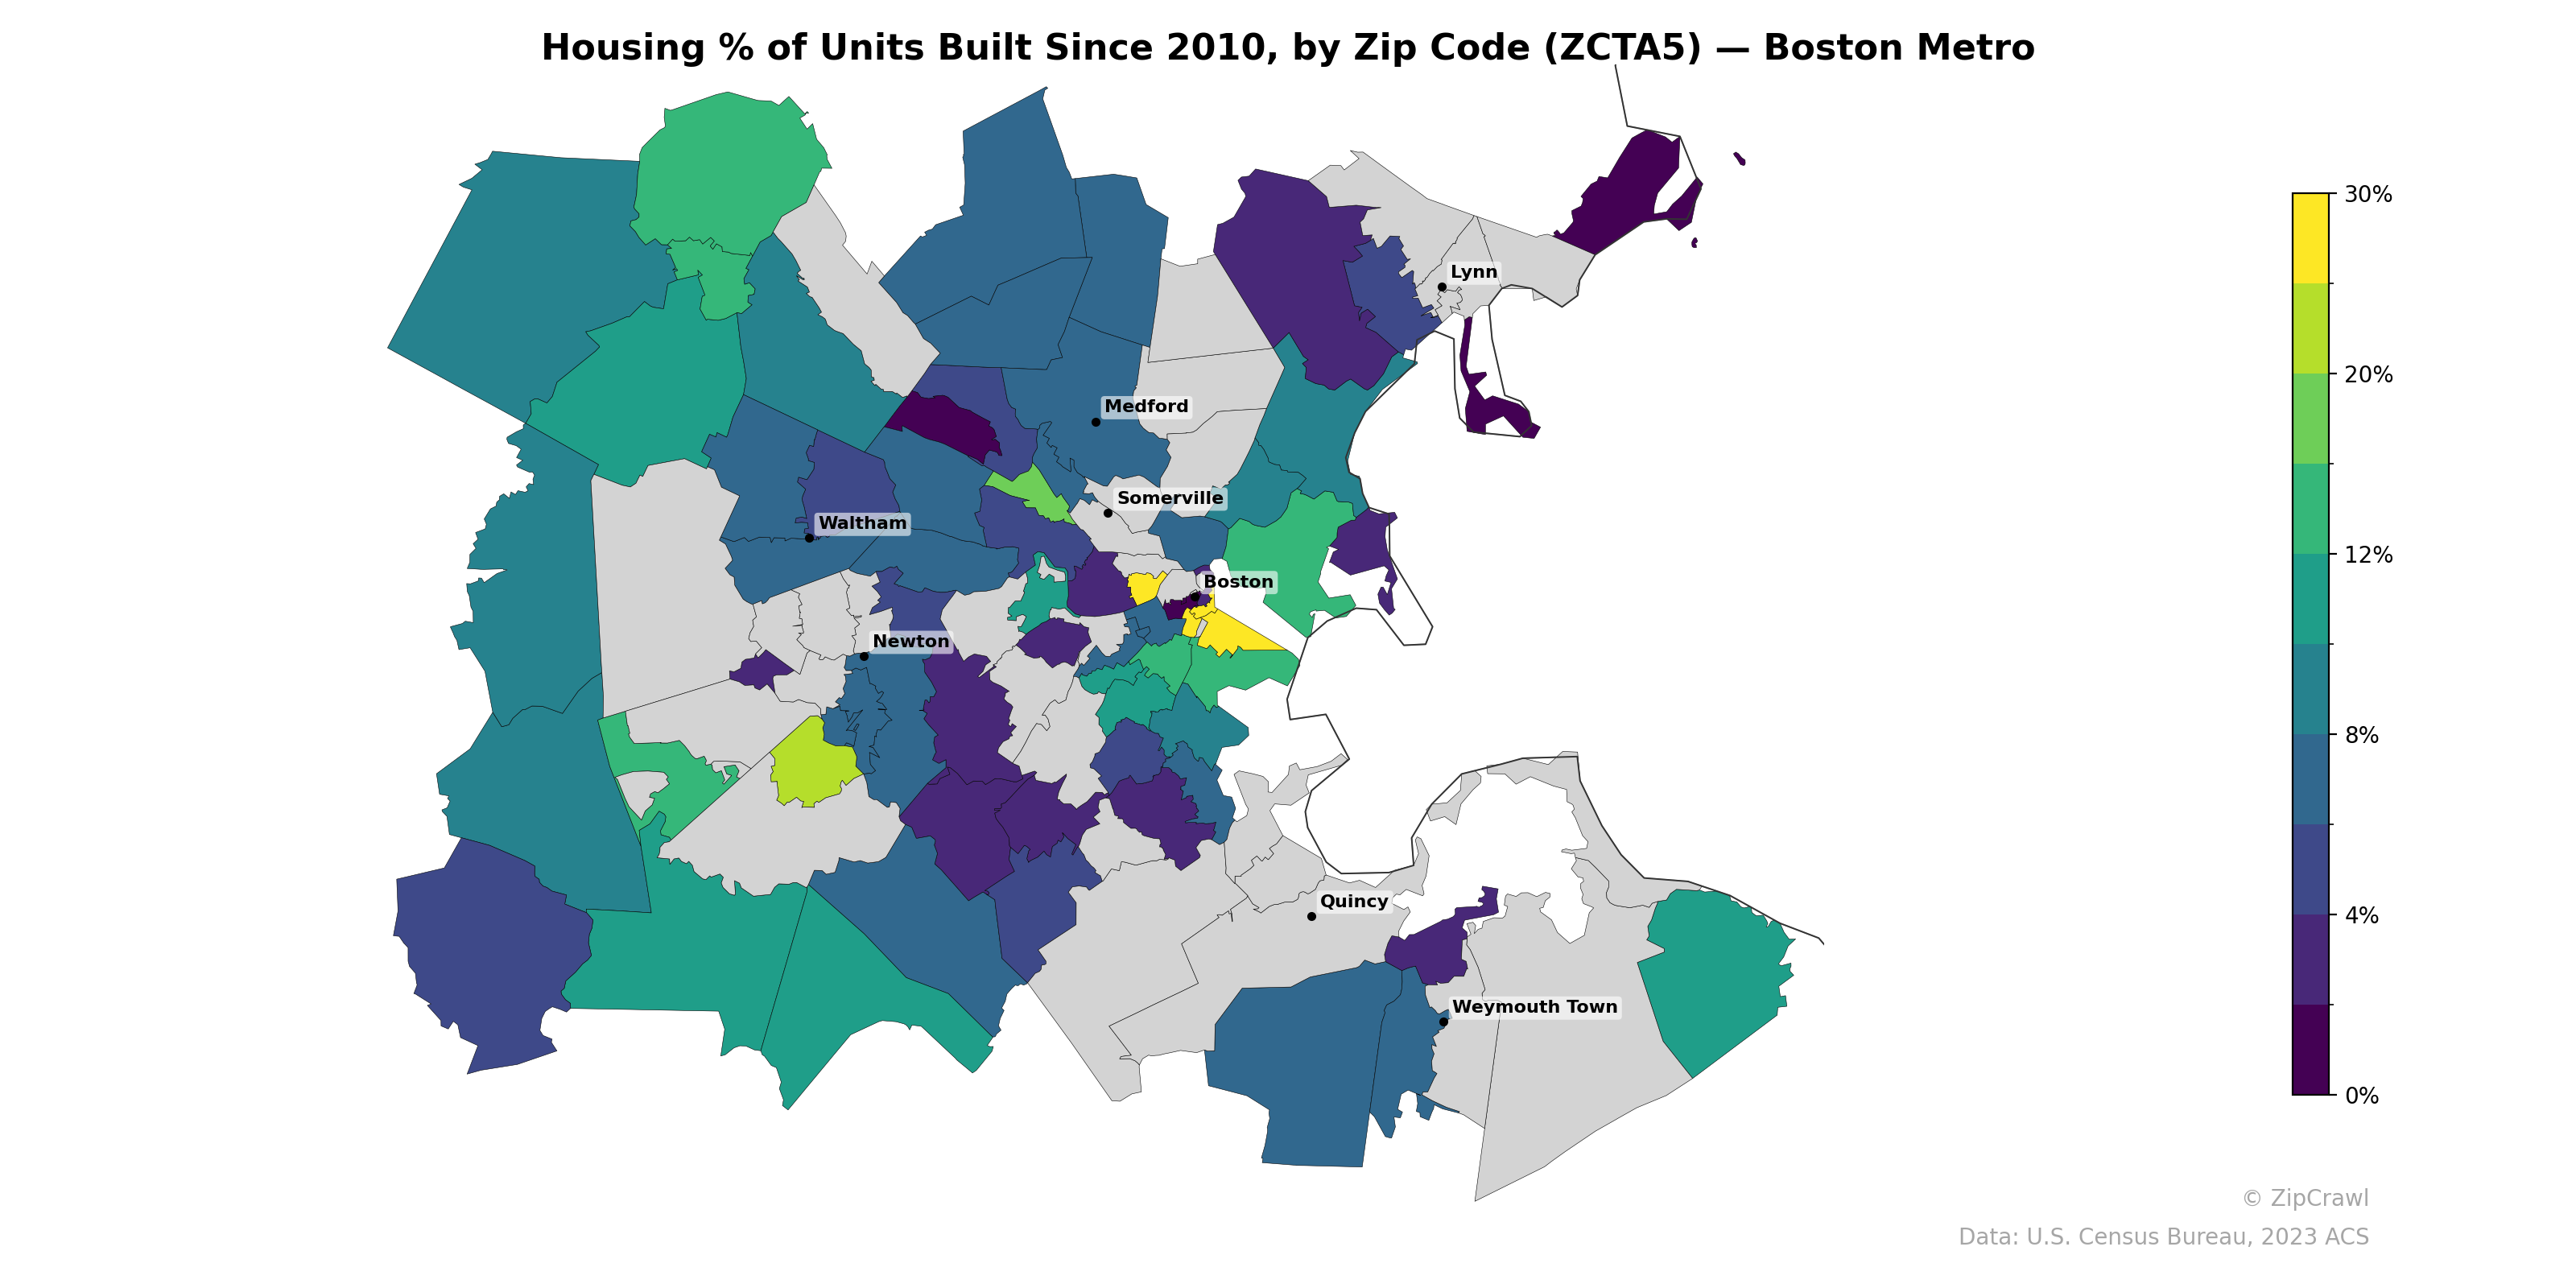
NOTE: Gray indicates insufficient data or a suppressed estimate.
New construction since 2010 is most heavily concentrated in Boston's Seaport/South Boston waterfront area, where zip codes reach approximately 25–30% of housing stock built in the last decade, along with notable pockets of development in the downtown core and select areas near the Somerville-Cambridge corridor. The outer suburban ring, particularly zones west of Newton and south through Quincy and Weymouth, generally reflects much lower rates of new construction, with many zip codes falling below 4%. A striking contrast exists between the northwest suburbs—where several zip codes show moderate 8–12% new build rates—and the largely stagnant southeast quadrant, suggesting that recent housing production has disproportionately favored urban infill and transit-accessible inner suburbs over more peripheral areas.
Data: U.S. Census Bureau, 2023 ACS
Explore
- % of Population on Food Stamps or SNAP (Last 12 Months), by Zip Code (ZCTA5) — Los Angeles Metro
- Married Couple (% of all Households) by Zip Code (ZCTA5) — Boston Metro
- Housing Median Monthly Rent ($), by Zip Code (ZCTA5) — Boston Metro
- Housing Vacancy Rate by Zip Code (ZCTA5) — Boston Metro
- % of Population without Health Insurance, by Zip Code (ZCTA5) — Boston Metro
- Housing Owner-Occupied % of Units, by Zip Code (ZCTA5) — Boston Metro
- Bachelor's Degree or Higher (% of Over 25) by Zip Code (ZCTA5) — Boston Metro
- Housing Owner-Occupied Median Value ($), by Zip Code (ZCTA5) — Boston Metro
- Household Average Size by Zip Code (ZCTA5) — Boston Metro
- % of Households with Broadband Internet, by Zip Code (ZCTA5) — Boston Metro
- Median Age by Zip Code (ZCTA5) — Wyoming
- % of Population without Health Insurance, by County
- Household Median Income by Zip Code (ZCTA5) — Chicago Metro
- Population Non-Hispanic Asian % by Zip Code (ZCTA5) — Los Angeles Metro
- Median Age by Zip Code (ZCTA5) — Chicago Metro
- Population Hispanic % by Zip Code (ZCTA5) — Chicago Metro
- Population Non-Hispanic Black % by Zip Code (ZCTA5) — Chicago Metro
- Population Non-Hispanic American Indian % by Zip Code (ZCTA5) — Chicago Metro
- Married Couple (% of all Households) by County
- High School Graduate (% of Over 25) by Zip Code (ZCTA5) — Chicago Metro
- Population Non-Hispanic White % by Zip Code (ZCTA5) — Chicago Metro
- U.S. Citizens (% of Population Over 18) by Zip Code (ZCTA5) — Chicago Metro
- Population Non-Hispanic American Indian % by Zip Code (ZCTA5) — Boston Metro
- Population Non-Hispanic White % by Zip Code (ZCTA5) — Boston Metro
- Population Non-Hispanic Black % by Zip Code (ZCTA5) — Boston Metro
- U.S. Citizens (% of Population Over 18) by Zip Code (ZCTA5) — Boston Metro
- Housing Owner-Occupied % of Units, by Zip Code (ZCTA5) — Seattle Metro
- Population Hispanic % by Zip Code (ZCTA5) — Boston Metro
- Household Median Income by Zip Code (ZCTA5) — Boston Metro
- High School Graduate (% of Over 25) by Zip Code (ZCTA5) — Detroit Metro
- Housing % of Units Built Since 2010, by Zip Code (ZCTA5) — Houston Metro
- Housing % of Units Built Since 2010, by Zip Code (ZCTA5) — Miami Metro
- Housing % of Units Built Since 2010, by Zip Code (ZCTA5) — Tampa Metro
- Housing % of Units Built Since 2010, by Zip Code (ZCTA5) — Detroit Metro
- Housing % of Units Built Since 2010, by Zip Code (ZCTA5) — Seattle Metro
- Housing % of Units Built Since 2010, by Zip Code (ZCTA5) — Denver Metro
- Housing % of Units Built Since 2010, by Zip Code (ZCTA5) — Dallas Metro
- Housing % of Units Built Since 2010, by Zip Code (ZCTA5) — Orlando Metro
- Housing % of Units Built Since 2010, by Zip Code (ZCTA5) — Chicago Metro
- Housing % of Units Built Since 2010, by Zip Code (ZCTA5) — Austin Metro