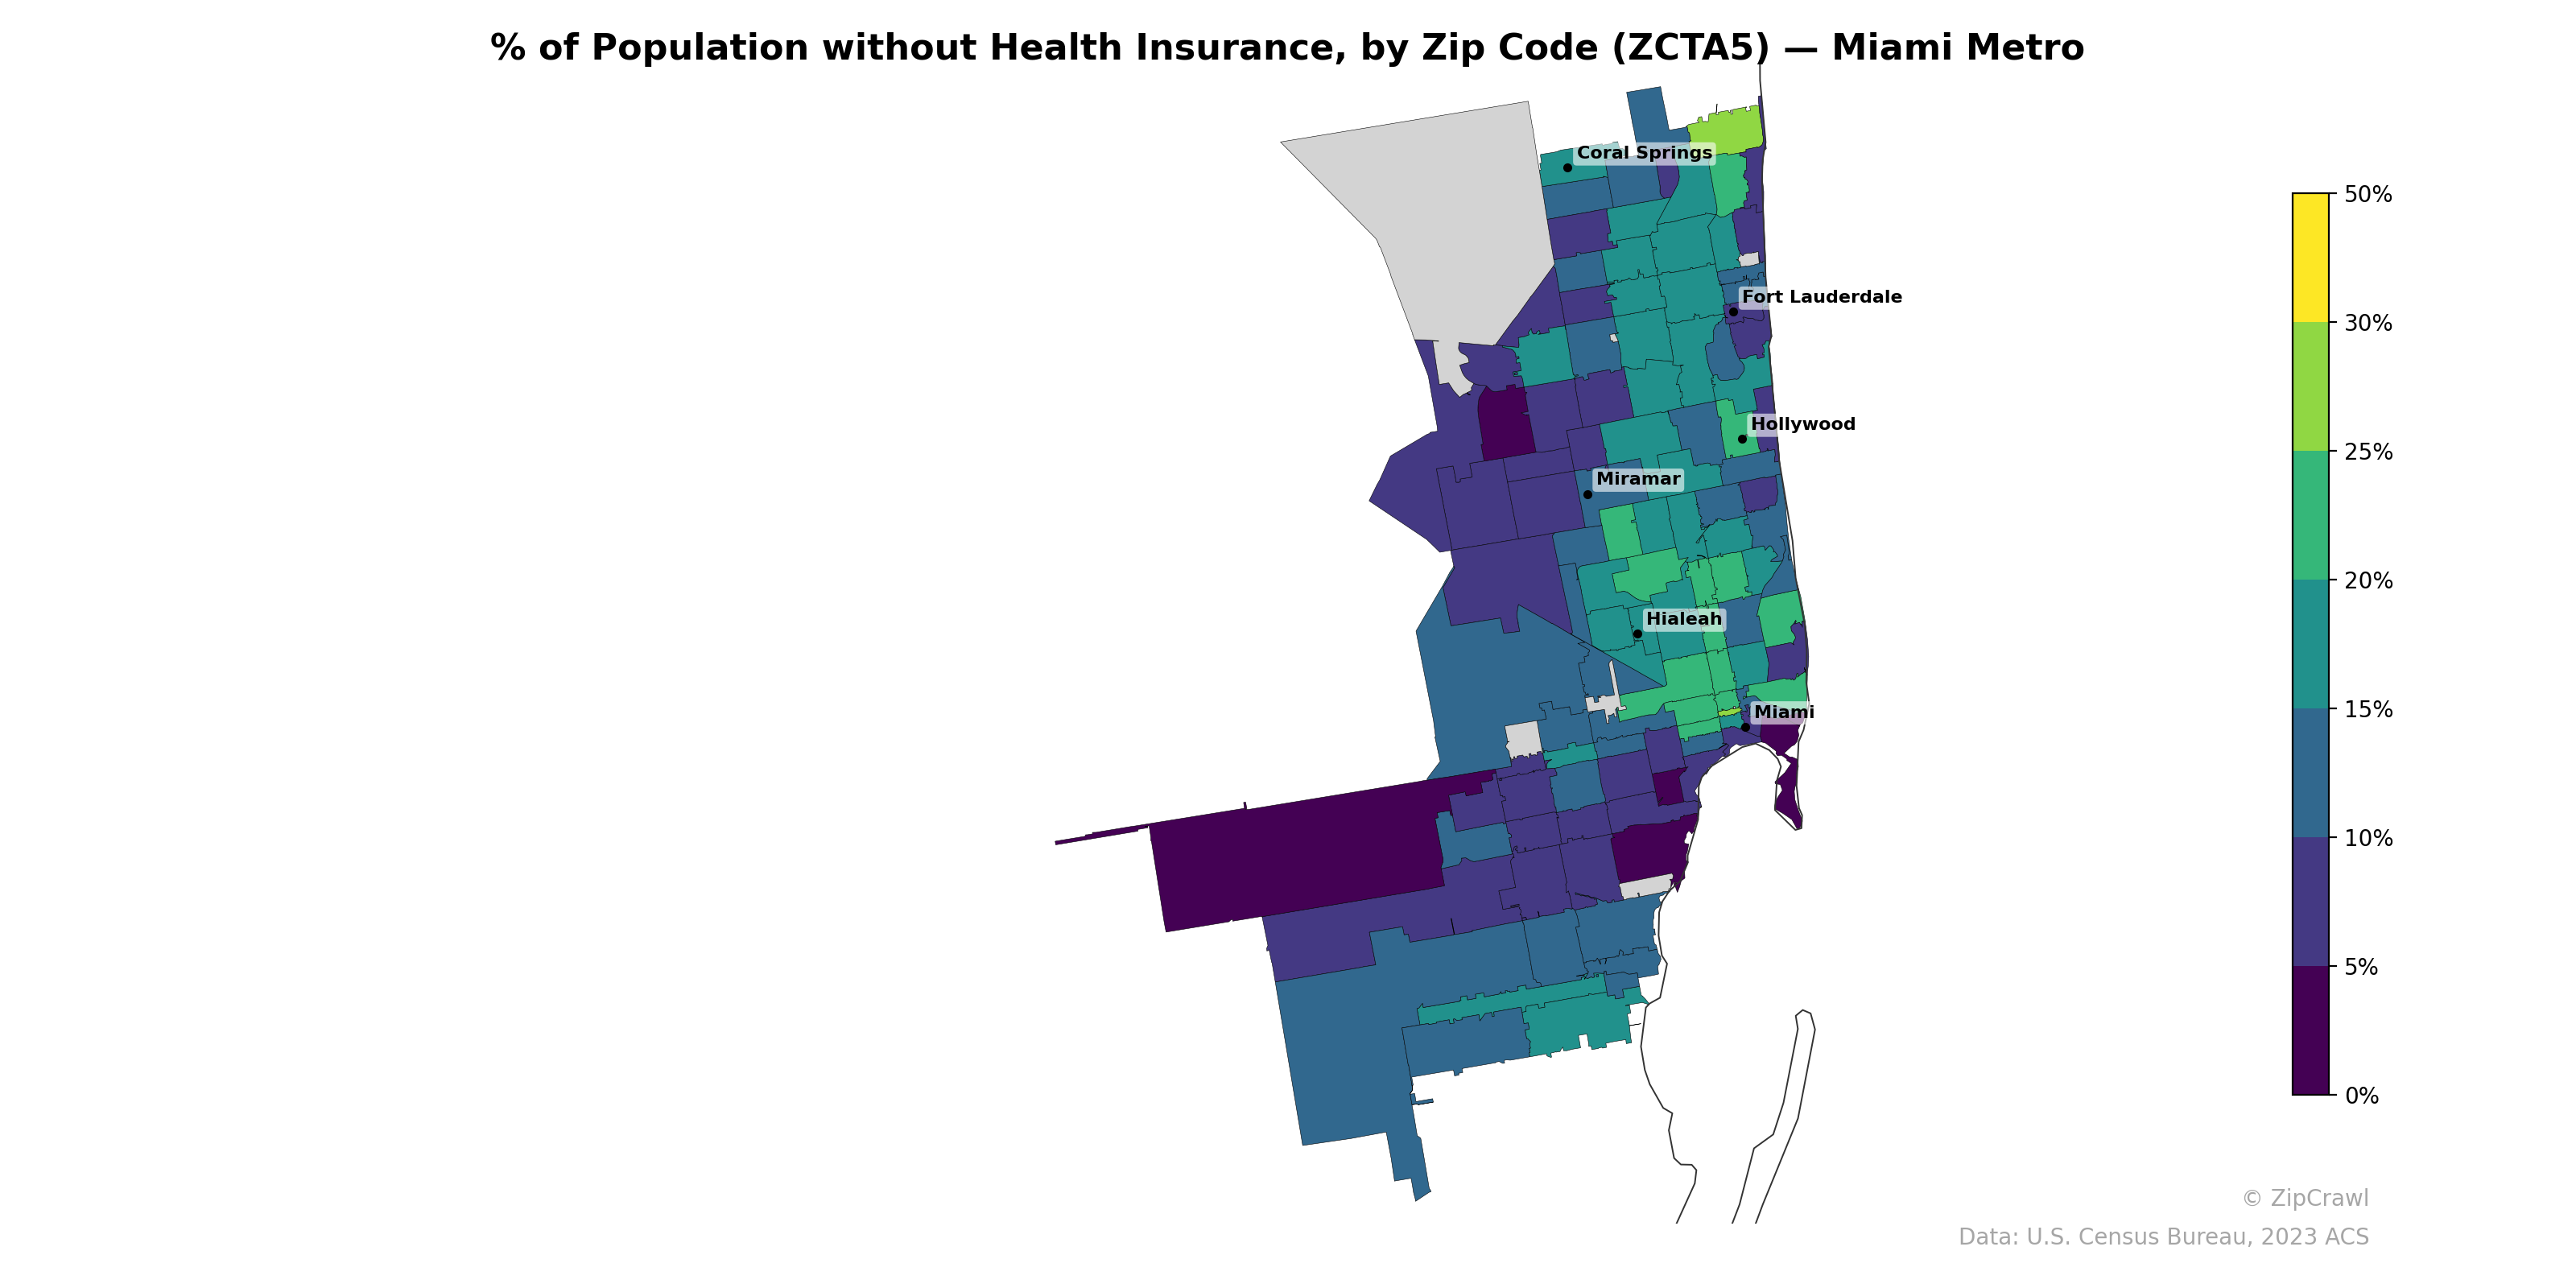
NOTE: Gray indicates insufficient data or a suppressed estimate.
Uninsured rates in the Miami metro vary dramatically by zip code, ranging from near 0% in parts of Key Biscayne and western exurban areas to upwards of 35–50% in select zip codes near Hialeah and pockets north of Coral Springs. A pronounced corridor of elevated uninsurance (20–30%+) runs through central Miami-Dade, encompassing Hialeah, parts of Miami proper, and surrounding working-class neighborhoods, while coastal Broward County zip codes around Fort Lauderdale and Hollywood generally fall in the 10–20% range. The lowest rates cluster along the western Everglades fringe and in affluent coastal enclaves, underscoring a clear socioeconomic gradient from inland urban cores to peripheral and beachfront communities.
Data: U.S. Census Bureau, 2023 ACS
Explore
- Bachelor's Degree or Higher (% of Over 25) by Zip Code (ZCTA5) — New York Metro
- Housing Vacancy Rate by Zip Code (ZCTA5) — Miami Metro
- Housing Owner-Occupied Median Value ($), by Zip Code (ZCTA5) — Miami Metro
- Housing Median Monthly Rent ($), by Zip Code (ZCTA5) — Miami Metro
- Married Couple (% of all Households) by Zip Code (ZCTA5) — Miami Metro
- Household Average Size by Zip Code (ZCTA5) — Miami Metro
- Housing % of Units Built Since 2010, by Zip Code (ZCTA5) — Miami Metro
- Bachelor's Degree or Higher (% of Over 25) by Zip Code (ZCTA5) — Miami Metro
- Housing Owner-Occupied % of Units, by Zip Code (ZCTA5) — Miami Metro
- % of Households with Broadband Internet, by Zip Code (ZCTA5) — Miami Metro
- Population Non-Hispanic Asian % by Zip Code (ZCTA5) — Arkansas
- Median Age by County
- U.S. Citizens (% of Population Over 18) by Zip Code (ZCTA5) — New York Metro
- Population Hispanic % by Zip Code (ZCTA5) — New York Metro
- Population Non-Hispanic White % by Zip Code (ZCTA5) — New York Metro
- % of Population on Food Stamps or SNAP (Last 12 Months), by County
- Population Non-Hispanic Black % by Zip Code (ZCTA5) — New York Metro
- Median Age by Zip Code (ZCTA5) — New York Metro
- Population Non-Hispanic American Indian % by Zip Code (ZCTA5) — New York Metro
- Household Median Income by Zip Code (ZCTA5) — New York Metro
- High School Graduate (% of Over 25) by Zip Code (ZCTA5) — New York Metro
- Housing Owner-Occupied Median Value ($), by Zip Code (ZCTA5) — Ohio
- % of Households with Broadband Internet, by Zip Code (ZCTA5) — Ohio
- Housing Median Monthly Rent ($), by Zip Code (ZCTA5) — Ohio
- Population Hispanic % by Zip Code (ZCTA5) — Ohio
- Population Non-Hispanic White % by Zip Code (ZCTA5) — Ohio
- High School Graduate (% of Over 25) by Zip Code (ZCTA5) — Ohio
- Bachelor's Degree or Higher (% of Over 25) by Zip Code (ZCTA5) — Ohio
- Housing Owner-Occupied % of Units, by Zip Code (ZCTA5) — Ohio
- Population Non-Hispanic Black % by Zip Code (ZCTA5) — Ohio
- % of Population without Health Insurance, by Zip Code (ZCTA5) — Boston Metro
- % of Population without Health Insurance, by Zip Code (ZCTA5) — Houston Metro
- % of Population without Health Insurance, by Zip Code (ZCTA5) — Tampa Metro
- % of Population without Health Insurance, by Zip Code (ZCTA5) — Detroit Metro
- % of Population without Health Insurance, by Zip Code (ZCTA5) — Phoenix Metro
- % of Population without Health Insurance, by Zip Code (ZCTA5) — Chicago Metro
- % of Population without Health Insurance, by Zip Code (ZCTA5) — Dallas Metro
- % of Population without Health Insurance, by Zip Code (ZCTA5) — Denver Metro
- % of Population without Health Insurance, by Zip Code (ZCTA5) — Orlando Metro
- % of Population without Health Insurance, by Zip Code (ZCTA5) — Austin Metro