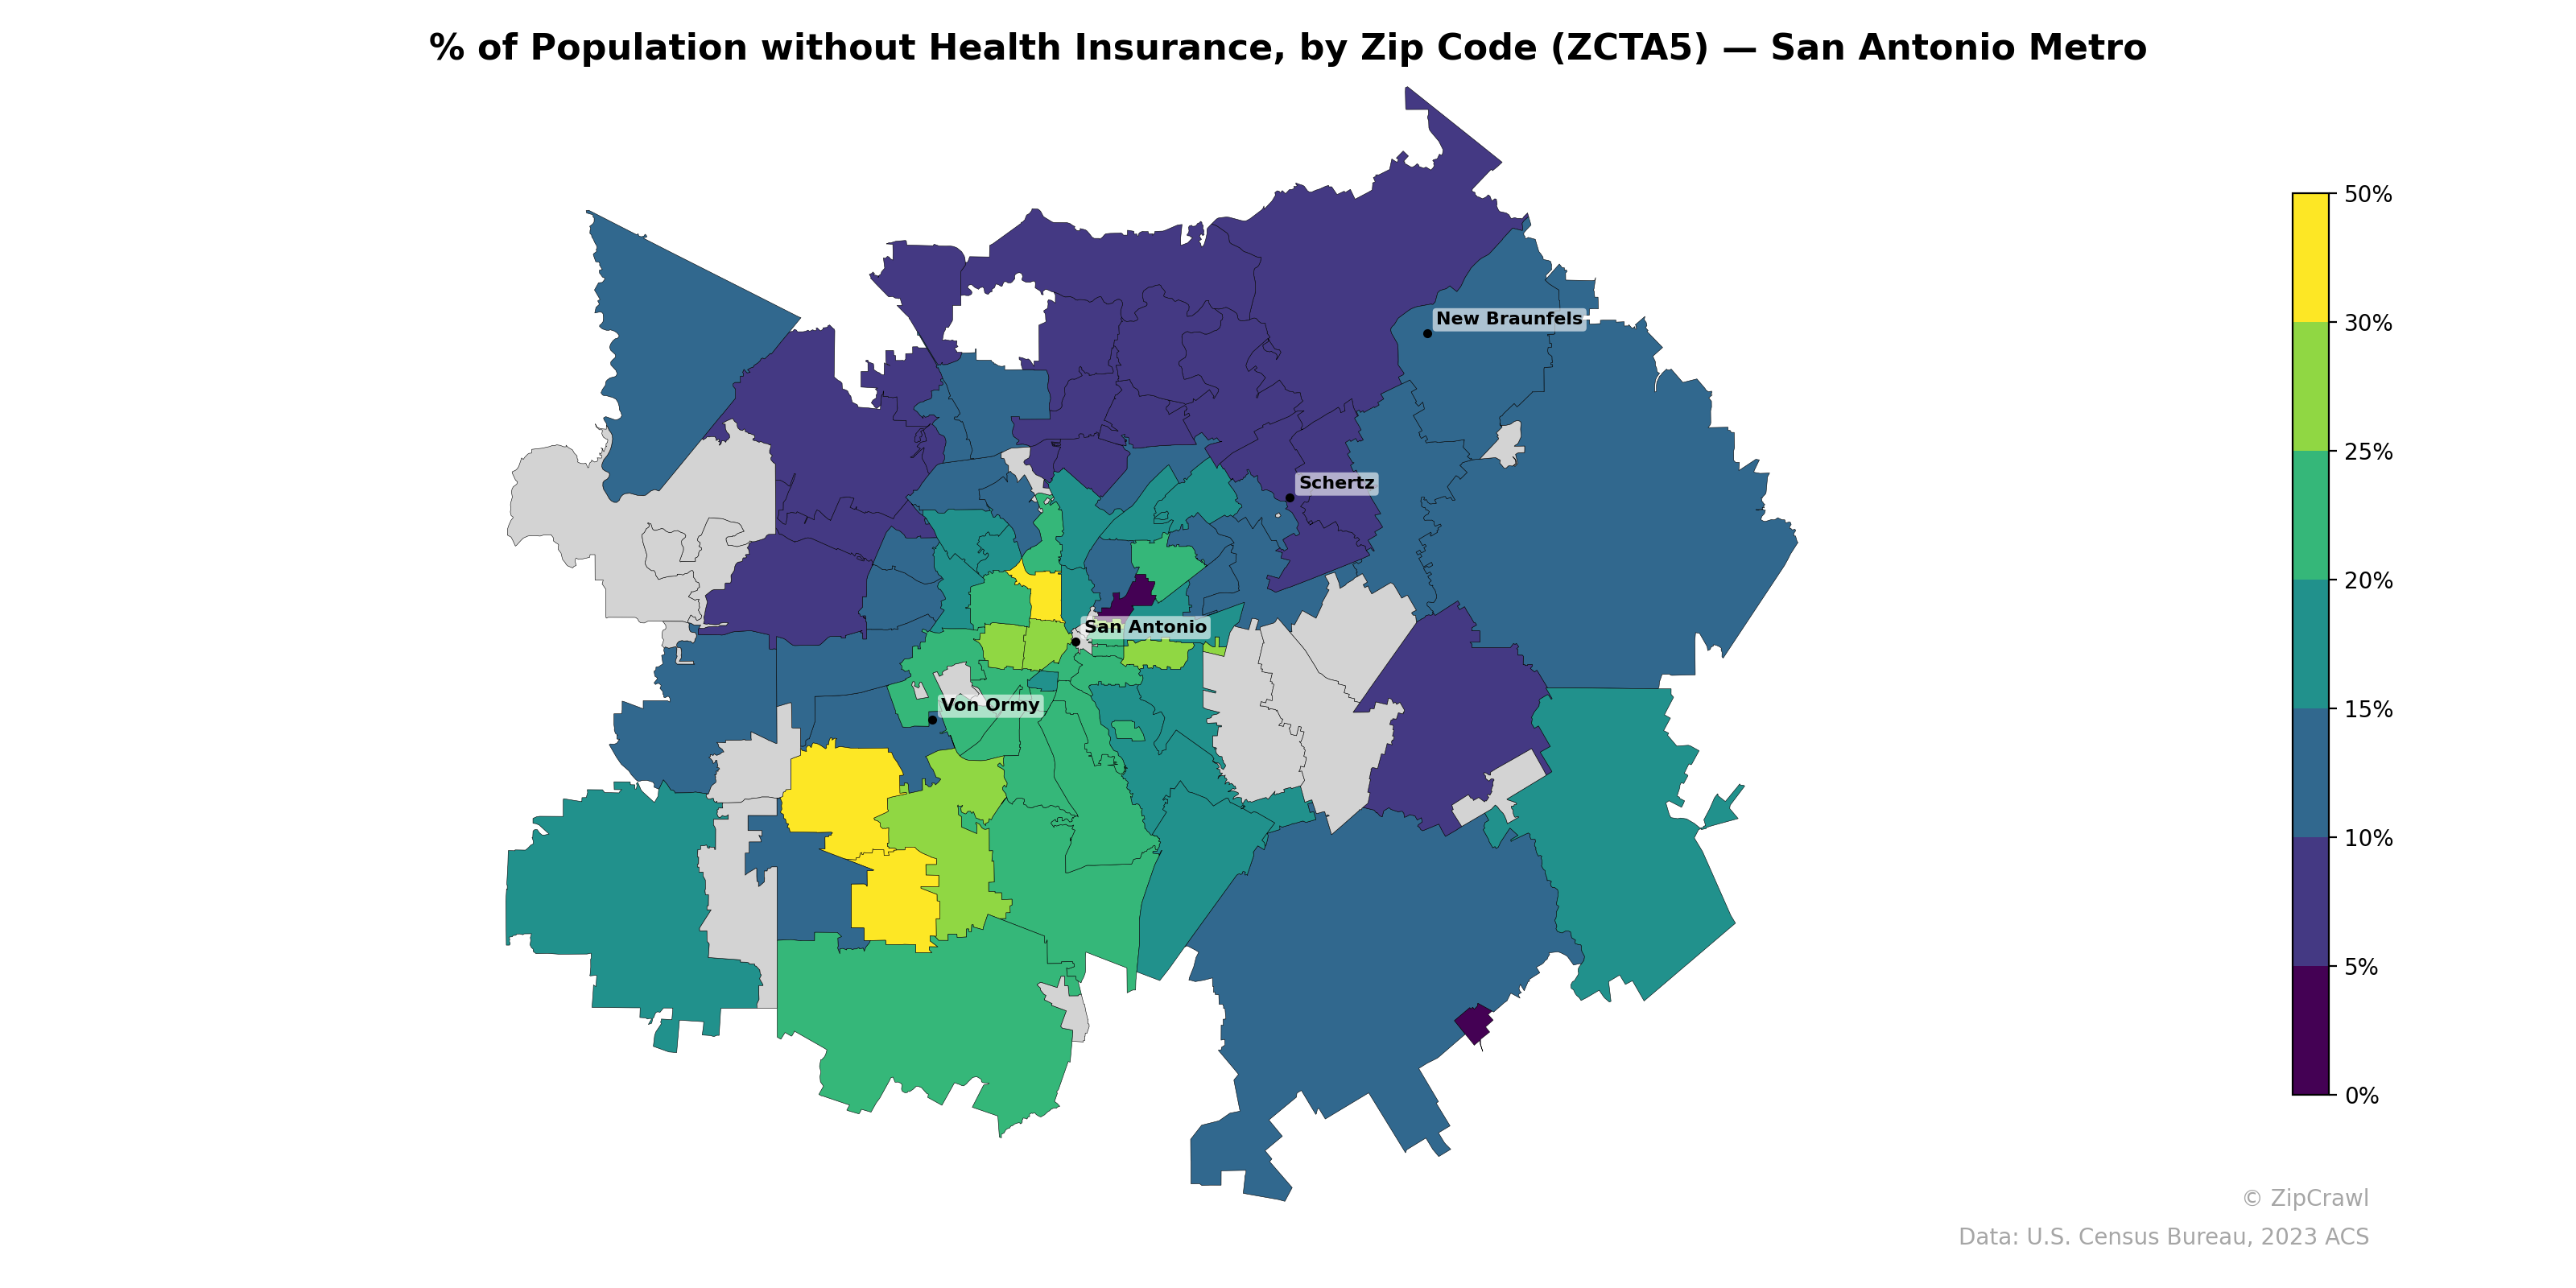
NOTE: Gray indicates insufficient data or a suppressed estimate.
Uninsured rates in the San Antonio metro concentrate most heavily in the south and southwest quadrants, where several zip codes southwest of Von Ormy and south of downtown reach 25–35% or higher, appearing in bright yellow-green tones. The northern and northeastern periphery—stretching toward New Braunfels and Schertz—consistently registers among the lowest uninsured rates at roughly 5–10%, reflecting the higher-income suburban corridors of those areas. A sharp gradient is visible radiating outward from the downtown core, where near-downtown zip codes on the south and west sides show markedly elevated uninsured levels compared to their counterparts just a few miles to the north and northwest.
Data: U.S. Census Bureau, 2023 ACS
Explore
- Population Non-Hispanic White % by Zip Code (ZCTA5) — Texas
- % of Households with Broadband Internet, by Zip Code (ZCTA5) — San Antonio Metro
- Bachelor's Degree or Higher (% of Over 25) by Zip Code (ZCTA5) — San Antonio Metro
- Household Average Size by Zip Code (ZCTA5) — San Antonio Metro
- Married Couple (% of all Households) by Zip Code (ZCTA5) — San Antonio Metro
- Housing Owner-Occupied % of Units, by Zip Code (ZCTA5) — San Antonio Metro
- Housing Vacancy Rate by Zip Code (ZCTA5) — San Antonio Metro
- Housing Owner-Occupied Median Value ($), by Zip Code (ZCTA5) — San Antonio Metro
- Housing Median Monthly Rent ($), by Zip Code (ZCTA5) — San Antonio Metro
- Housing % of Units Built Since 2010, by Zip Code (ZCTA5) — San Antonio Metro
- High School Graduate (% of Over 25) by County
- U.S. Citizens (% of Population Over 18) by Zip Code (ZCTA5) — Texas
- Household Median Income by Zip Code (ZCTA5) — Texas
- Population Non-Hispanic Asian % by Zip Code (ZCTA5) — Chicago Metro
- Population Hispanic % by Zip Code (ZCTA5) — Texas
- Population Non-Hispanic American Indian % by Zip Code (ZCTA5) — Texas
- Median Age by Zip Code (ZCTA5) — Texas
- Population Non-Hispanic Black % by Zip Code (ZCTA5) — Texas
- High School Graduate (% of Over 25) by Zip Code (ZCTA5) — Texas
- % of Population on Food Stamps or SNAP (Last 12 Months), by Zip Code (ZCTA5) — Chicago Metro
- Housing Owner-Occupied % of Units, by Zip Code (ZCTA5) — Baltimore Metro
- % of Households with Broadband Internet, by Zip Code (ZCTA5) — Baltimore Metro
- Housing Owner-Occupied Median Value ($), by Zip Code (ZCTA5) — Baltimore Metro
- % of Population on Food Stamps or SNAP (Last 12 Months), by Zip Code (ZCTA5) — Charlotte Metro
- Population Non-Hispanic Asian % by Zip Code (ZCTA5) — Charlotte Metro
- U.S. Citizens (% of Population Over 18) by Zip Code (ZCTA5) — Baltimore Metro
- High School Graduate (% of Over 25) by Zip Code (ZCTA5) — Baltimore Metro
- Bachelor's Degree or Higher (% of Over 25) by Zip Code (ZCTA5) — Baltimore Metro
- Population Non-Hispanic American Indian % by Zip Code (ZCTA5) — Baltimore Metro
- Population Non-Hispanic Black % by Zip Code (ZCTA5) — Baltimore Metro
- % of Population without Health Insurance, by Zip Code (ZCTA5) — San Diego Metro
- % of Population without Health Insurance, by Zip Code (ZCTA5) — Boston Metro
- % of Population without Health Insurance, by Zip Code (ZCTA5) — Houston Metro
- % of Population without Health Insurance, by Zip Code (ZCTA5) — San Francisco Metro
- % of Population without Health Insurance, by Zip Code (ZCTA5) — Atlanta Metro
- % of Population without Health Insurance, by Zip Code (ZCTA5) — Austin Metro
- % of Population without Health Insurance, by Zip Code (ZCTA5) — Miami Metro
- % of Population without Health Insurance, by Zip Code (ZCTA5) — Seattle Metro
- % of Population without Health Insurance, by Zip Code (ZCTA5) — Detroit Metro
- % of Population without Health Insurance, by Zip Code (ZCTA5) — Tampa Metro