NOTE: Gray indicates insufficient data or a suppressed estimate.
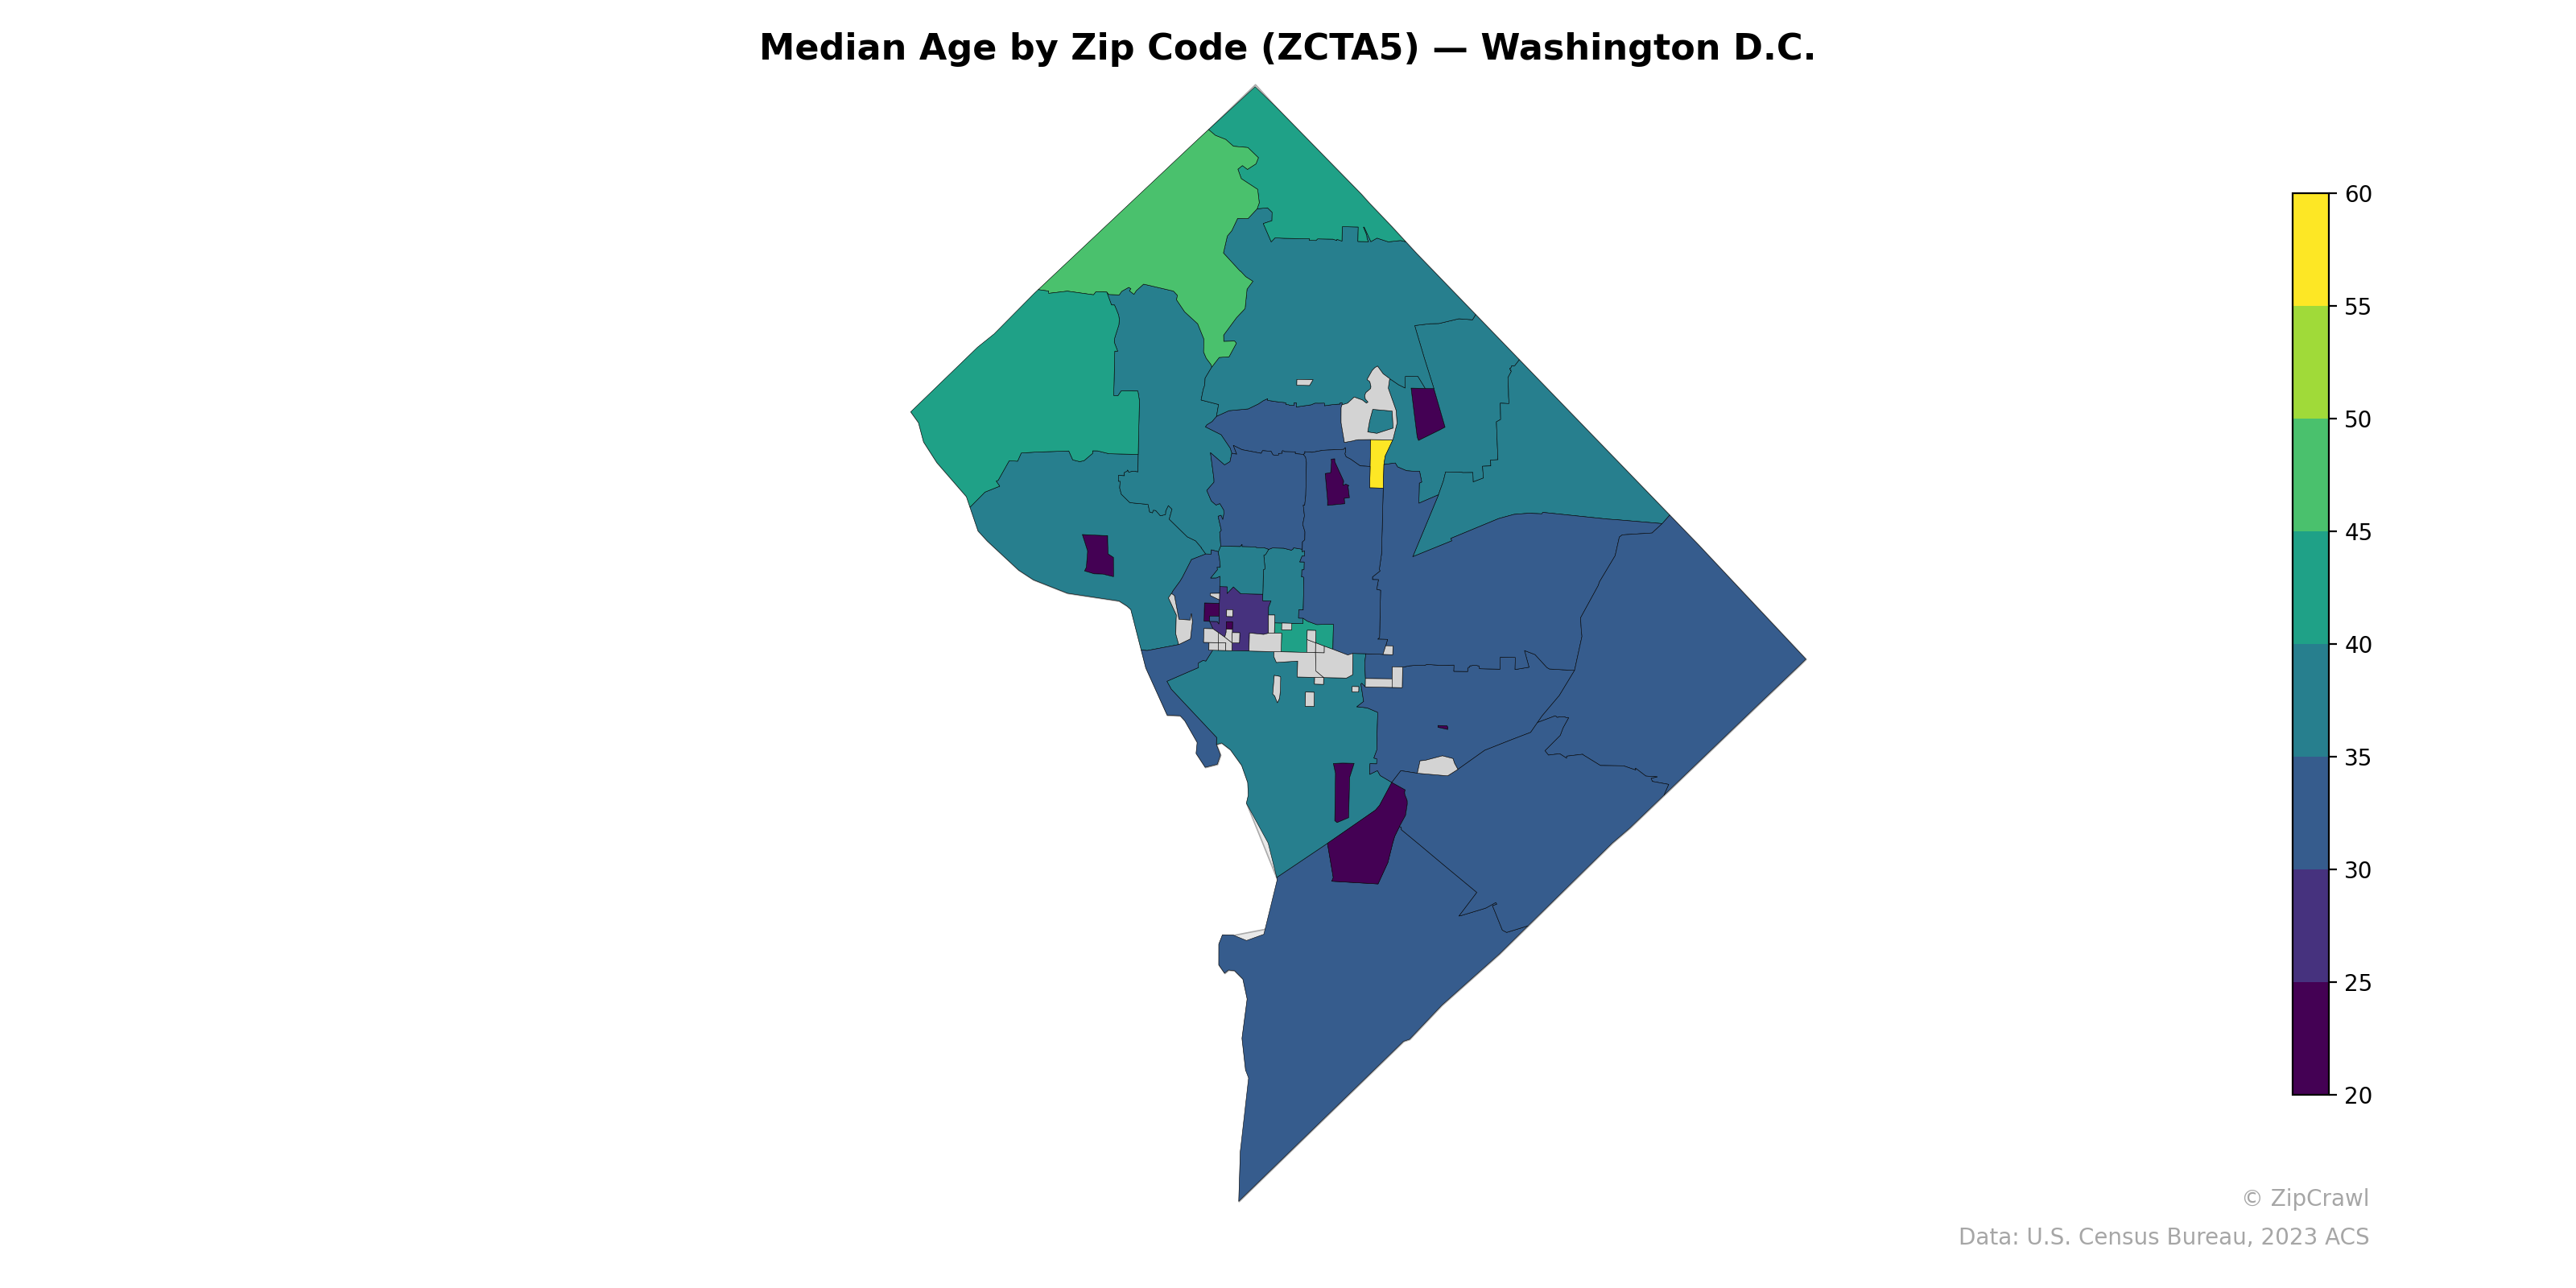
The northern tier of Washington D.C., particularly the upper Northwest neighborhoods around zip codes corresponding to areas like Chevy Chase and Tenleytown, registers the highest median ages at 50–60+, reflecting established residential communities with longer-tenured homeowners. In sharp contrast, the central corridor and Southeast quadrant skew significantly younger, with median ages in the low-to-mid 30s, consistent with areas experiencing rapid development and an influx of younger professionals. A few small zip codes in the downtown and near-Southwest area drop to the lowest values on the scale (around 20–25), likely corresponding to university campuses or dense young-renter districts such as Foggy Bottom near George Washington University.
Data: U.S. Census Bureau, 2023 ACS
Explore
- Household Median Income by Zip Code (ZCTA5) — Illinois
- Married Couple (% of all Households) by Zip Code (ZCTA5) — Wyoming
- Population Non-Hispanic White % by Zip Code (ZCTA5) — Washington D.C.
- Population Non-Hispanic Asian % by Zip Code (ZCTA5) — Wyoming
- Population Non-Hispanic Black % by Zip Code (ZCTA5) — Washington D.C.
- Population Hispanic % by Zip Code (ZCTA5) — Washington D.C.
- Household Median Income by Zip Code (ZCTA5) — Washington D.C.
- U.S. Citizens (% of Population Over 18) by Zip Code (ZCTA5) — Washington D.C.
- % of Population on Food Stamps or SNAP (Last 12 Months), by Zip Code (ZCTA5) — Wyoming
- Housing Vacancy Rate by Zip Code (ZCTA5) — Wyoming
- Married Couple (% of all Households) by County
- High School Graduate (% of Over 25) by Zip Code (ZCTA5) — Illinois
- Housing % of Units Built Since 2010, by Zip Code (ZCTA5) — San Francisco Metro
- Population Non-Hispanic American Indian % by Zip Code (ZCTA5) — Illinois
- Housing % of Units Built Since 2010, by Zip Code (ZCTA5) — Florida
- Population Non-Hispanic White % by Zip Code (ZCTA5) — Illinois
- U.S. Citizens (% of Population Over 18) by Zip Code (ZCTA5) — Illinois
- Population Hispanic % by Zip Code (ZCTA5) — Illinois
- Population Non-Hispanic Asian % by Zip Code (ZCTA5) — New York
- % of Population on Food Stamps or SNAP (Last 12 Months), by Zip Code (ZCTA5) — New York
- Population Non-Hispanic Black % by Zip Code (ZCTA5) — Illinois
- Bachelor's Degree or Higher (% of Over 25) by Zip Code (ZCTA5) — Vermont
- High School Graduate (% of Over 25) by Zip Code (ZCTA5) — Vermont
- Population Non-Hispanic Asian % by Zip Code (ZCTA5) — Vermont
- Married Couple (% of all Households) by Zip Code (ZCTA5) — Vermont
- % of Households with Broadband Internet, by Zip Code (ZCTA5) — Vermont
- Housing Vacancy Rate by Zip Code (ZCTA5) — Vermont
- % of Households with Broadband Internet, by Zip Code (ZCTA5) — Oregon
- Population Non-Hispanic American Indian % by Zip Code (ZCTA5) — Vermont
- % of Population on Food Stamps or SNAP (Last 12 Months), by Zip Code (ZCTA5) — Vermont
- Median Age by Zip Code (ZCTA5) — Washington
- Median Age by Zip Code (ZCTA5) — Washington D.C. Metro
- Median Age by Zip Code (ZCTA5) — Wyoming
- Median Age by Zip Code (ZCTA5) — Oregon
- Median Age by Zip Code (ZCTA5) — Boston Metro
- Median Age by Zip Code (ZCTA5) — Maine
- Median Age by Zip Code (ZCTA5) — Iowa
- Median Age by Zip Code (ZCTA5) — Ohio
- Median Age by Zip Code (ZCTA5) — Utah
- Median Age by Zip Code (ZCTA5) — Indiana