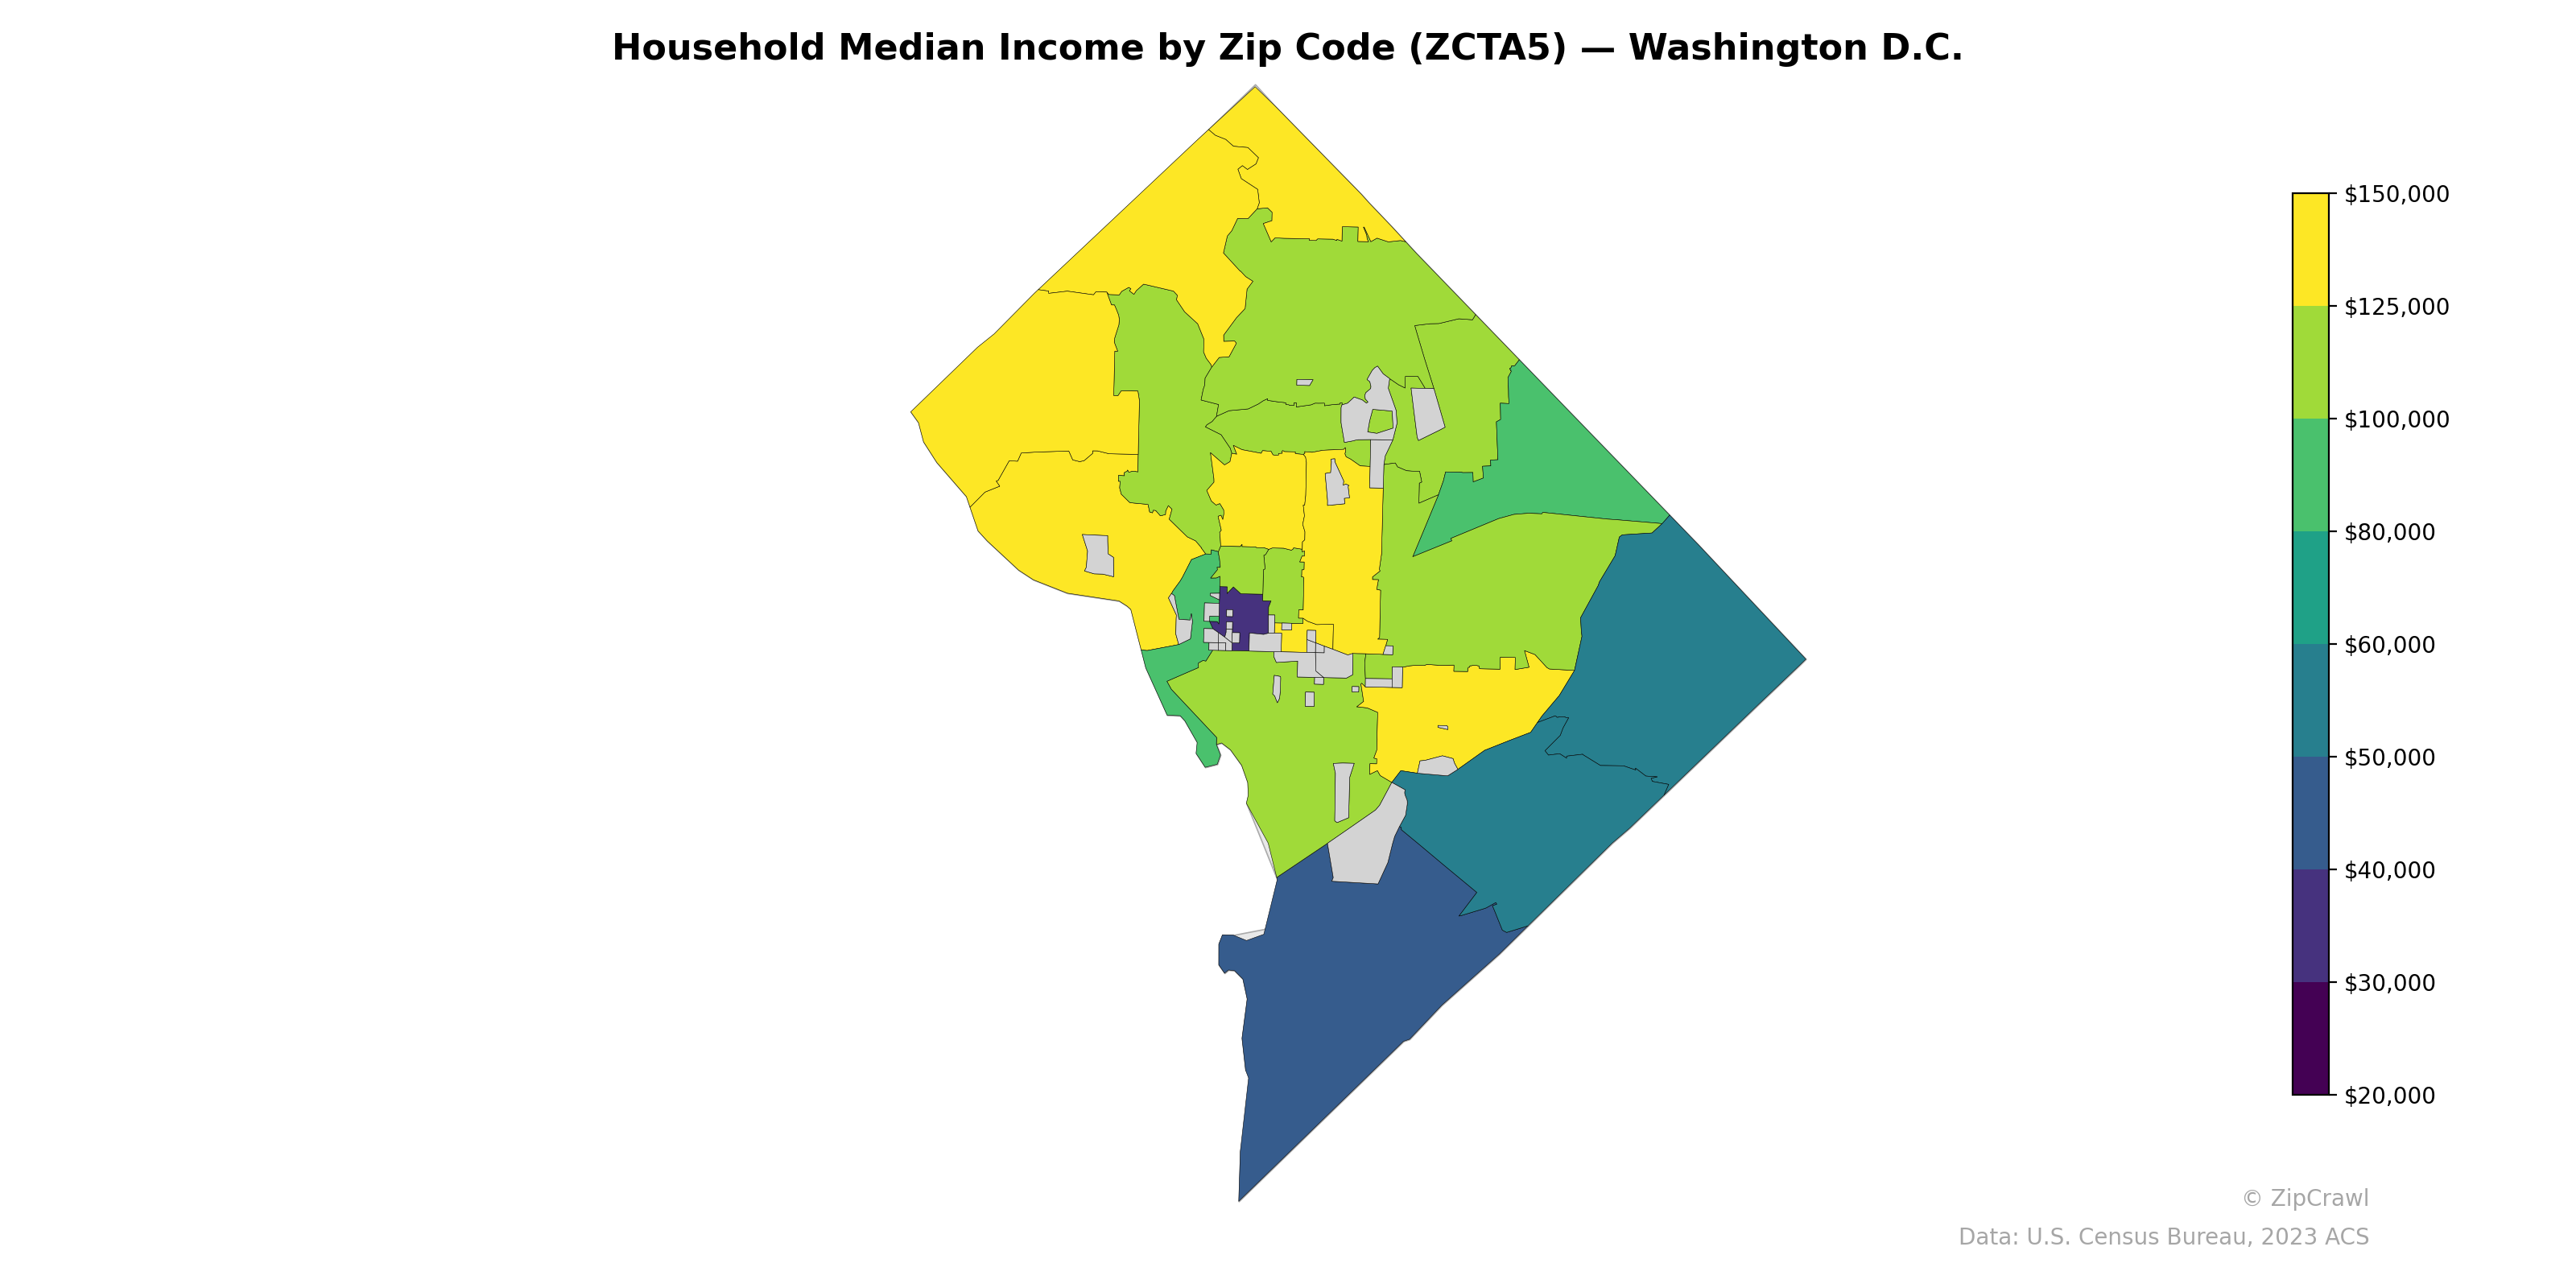
NOTE: Gray indicates insufficient data or a suppressed estimate.
Northwest Washington zip codes, particularly in the upper northwest neighborhoods, exhibit the highest household median incomes at or above $125,000–$150,000, forming a distinct high-income corridor that extends from the northern tip of the District southward through the central-west area. In stark contrast, zip codes in the far southeast and portions of northeast D.C. register median incomes below $40,000–$50,000, with at least one small central zip code dropping to approximately $20,000, likely corresponding to a predominantly institutional or student-populated area. The central and southwest portions of the District display moderate incomes in the $60,000–$100,000 range, creating a clear east-west income gradient that reflects long-standing socioeconomic disparities along the Anacostia River divide.
Data: U.S. Census Bureau, 2023 ACS
Explore
- Married Couple (% of all Households) by Zip Code (ZCTA5) — Wyoming
- Population Non-Hispanic Asian % by Zip Code (ZCTA5) — Wyoming
- Median Age by Zip Code (ZCTA5) — Washington D.C.
- % of Population on Food Stamps or SNAP (Last 12 Months), by Zip Code (ZCTA5) — Wyoming
- Population Non-Hispanic Black % by Zip Code (ZCTA5) — Washington D.C.
- Population Hispanic % by Zip Code (ZCTA5) — Washington D.C.
- Population Non-Hispanic White % by Zip Code (ZCTA5) — Washington D.C.
- U.S. Citizens (% of Population Over 18) by Zip Code (ZCTA5) — Washington D.C.
- Housing Vacancy Rate by Zip Code (ZCTA5) — Wyoming
- Married Couple (% of all Households) by County
- Housing Median Monthly Rent ($), by Zip Code (ZCTA5) — San Francisco Metro
- Population Non-Hispanic American Indian % by Zip Code (ZCTA5) — Illinois
- High School Graduate (% of Over 25) by Zip Code (ZCTA5) — Illinois
- Housing Median Monthly Rent ($), by Zip Code (ZCTA5) — Florida
- Population Non-Hispanic White % by Zip Code (ZCTA5) — Illinois
- Median Age by Zip Code (ZCTA5) — Illinois
- Population Hispanic % by Zip Code (ZCTA5) — Illinois
- Population Non-Hispanic Asian % by Zip Code (ZCTA5) — New York
- Population Non-Hispanic Black % by Zip Code (ZCTA5) — Illinois
- U.S. Citizens (% of Population Over 18) by Zip Code (ZCTA5) — Illinois
- % of Population on Food Stamps or SNAP (Last 12 Months), by Zip Code (ZCTA5) — New York
- Bachelor's Degree or Higher (% of Over 25) by Zip Code (ZCTA5) — Vermont
- % of Households with Broadband Internet, by Zip Code (ZCTA5) — Vermont
- % of Population on Food Stamps or SNAP (Last 12 Months), by Zip Code (ZCTA5) — Vermont
- % of Population without Health Insurance, by Zip Code (ZCTA5) — Vermont
- % of Households with Broadband Internet, by Zip Code (ZCTA5) — Oregon
- Population Non-Hispanic American Indian % by Zip Code (ZCTA5) — Vermont
- High School Graduate (% of Over 25) by Zip Code (ZCTA5) — Vermont
- Population Non-Hispanic Asian % by Zip Code (ZCTA5) — Vermont
- U.S. Citizens (% of Population Over 18) by Zip Code (ZCTA5) — Wyoming
- Household Median Income by Zip Code (ZCTA5) — Washington
- Household Median Income by Zip Code (ZCTA5) — Washington D.C. Metro
- Household Median Income by Zip Code (ZCTA5) — Houston Metro
- Household Median Income by Zip Code (ZCTA5) — Wyoming
- Household Median Income by Zip Code (ZCTA5) — Indiana
- Household Median Income by Zip Code (ZCTA5) — Iowa
- Household Median Income by Zip Code (ZCTA5) — Oregon
- Household Median Income by Zip Code (ZCTA5) — Ohio
- Household Median Income by Zip Code (ZCTA5) — Utah
- Household Median Income by Zip Code (ZCTA5) — Idaho