NOTE: Gray indicates insufficient data or a suppressed estimate.
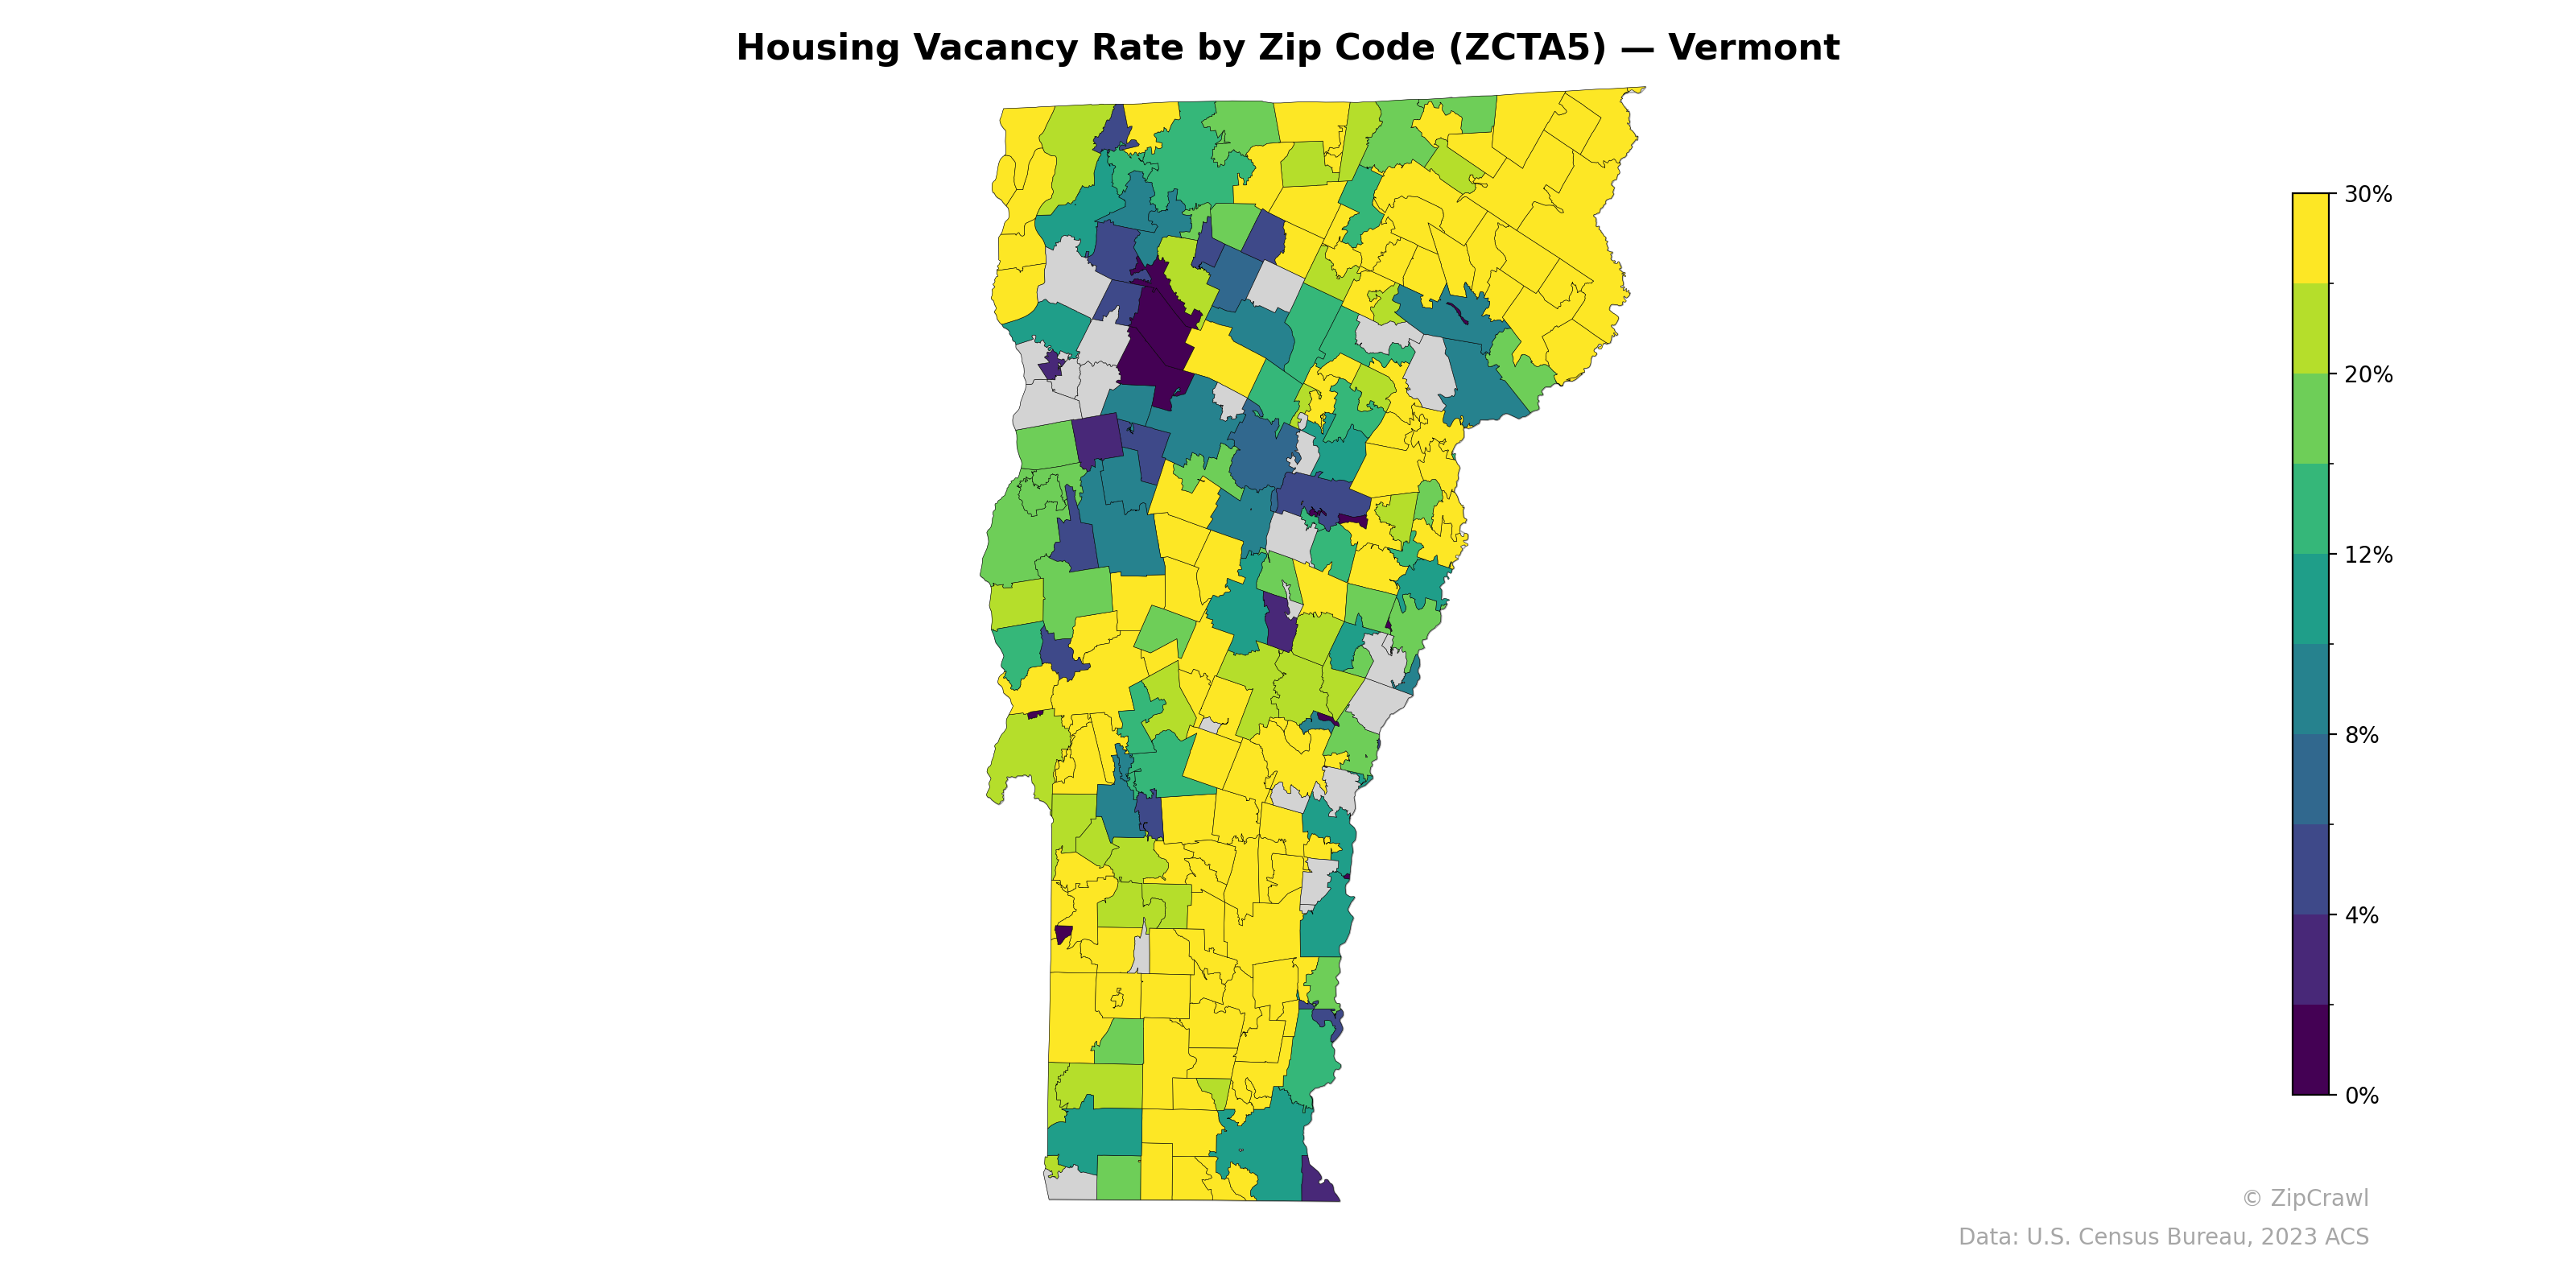
Vermont's housing vacancy rates exhibit a striking north-south gradient, with the northeastern region—particularly the Northeast Kingdom area—displaying consistently high vacancy rates above 20%, rendered in bright yellow, while the central-western corridor around Burlington and Montpelier maintains significantly lower rates below 8%. The southern third of the state shows moderate vacancy levels interspersed with pockets of lower vacancy, particularly along the more urbanized western edge near Bennington and Brattleboro. A notable cluster of very low vacancy rates (under 4%) appears in the north-central area around Stowe and the Mad River Valley, likely reflecting tight housing markets in popular resort and amenity-rich communities.
Data: U.S. Census Bureau, 2023 ACS
Explore
- % of Population on Food Stamps or SNAP (Last 12 Months), by Zip Code (ZCTA5) — New York
- Married Couple (% of all Households) by Zip Code (ZCTA5) — Vermont
- % of Population on Food Stamps or SNAP (Last 12 Months), by Zip Code (ZCTA5) — Vermont
- Household Median Income by Zip Code (ZCTA5) — Wyoming
- Population Non-Hispanic White % by Zip Code (ZCTA5) — Wyoming
- Population Hispanic % by Zip Code (ZCTA5) — Wyoming
- U.S. Citizens (% of Population Over 18) by Zip Code (ZCTA5) — Wyoming
- Population Non-Hispanic Asian % by Zip Code (ZCTA5) — Vermont
- Population Non-Hispanic Black % by Zip Code (ZCTA5) — Wyoming
- Median Age by Zip Code (ZCTA5) — Wyoming
- Married Couple (% of all Households) by County
- Housing Owner-Occupied % of Units, by County
- % of Households with Broadband Internet, by Zip Code (ZCTA5) — Boston Metro
- Population Non-Hispanic American Indian % by Zip Code (ZCTA5) — Illinois
- High School Graduate (% of Over 25) by Zip Code (ZCTA5) — Illinois
- Population Non-Hispanic White % by Zip Code (ZCTA5) — Illinois
- Median Age by Zip Code (ZCTA5) — Illinois
- Population Hispanic % by Zip Code (ZCTA5) — Illinois
- Population Non-Hispanic Asian % by Zip Code (ZCTA5) — New York
- Household Median Income by Zip Code (ZCTA5) — Illinois
- Population Non-Hispanic Black % by Zip Code (ZCTA5) — Illinois
- % of Households with Broadband Internet, by Zip Code (ZCTA5) — California
- U.S. Citizens (% of Population Over 18) by Zip Code (ZCTA5) — Illinois
- Household Average Size by Zip Code (ZCTA5) — Vermont
- Population Non-Hispanic American Indian % by Zip Code (ZCTA5) — Vermont
- % of Households with Broadband Internet, by Zip Code (ZCTA5) — Vermont
- Population Hispanic % by Zip Code (ZCTA5) — Washington D.C.
- High School Graduate (% of Over 25) by Zip Code (ZCTA5) — Vermont
- Bachelor's Degree or Higher (% of Over 25) by Zip Code (ZCTA5) — Vermont
- % of Population without Health Insurance, by Zip Code (ZCTA5) — Vermont
- Housing Vacancy Rate by Zip Code (ZCTA5) — Montana
- Housing Vacancy Rate by Zip Code (ZCTA5) — Ohio
- Housing Vacancy Rate by Zip Code (ZCTA5) — Iowa
- Housing Vacancy Rate by Zip Code (ZCTA5) — Utah
- Housing Vacancy Rate by Zip Code (ZCTA5) — Maine
- Housing Vacancy Rate by Zip Code (ZCTA5) — Wyoming
- Housing Vacancy Rate by Zip Code (ZCTA5) — Texas
- Housing Vacancy Rate by Zip Code (ZCTA5) — Idaho
- Housing Vacancy Rate by Zip Code (ZCTA5) — Hawaii
- Housing Vacancy Rate by Zip Code (ZCTA5) — Alaska