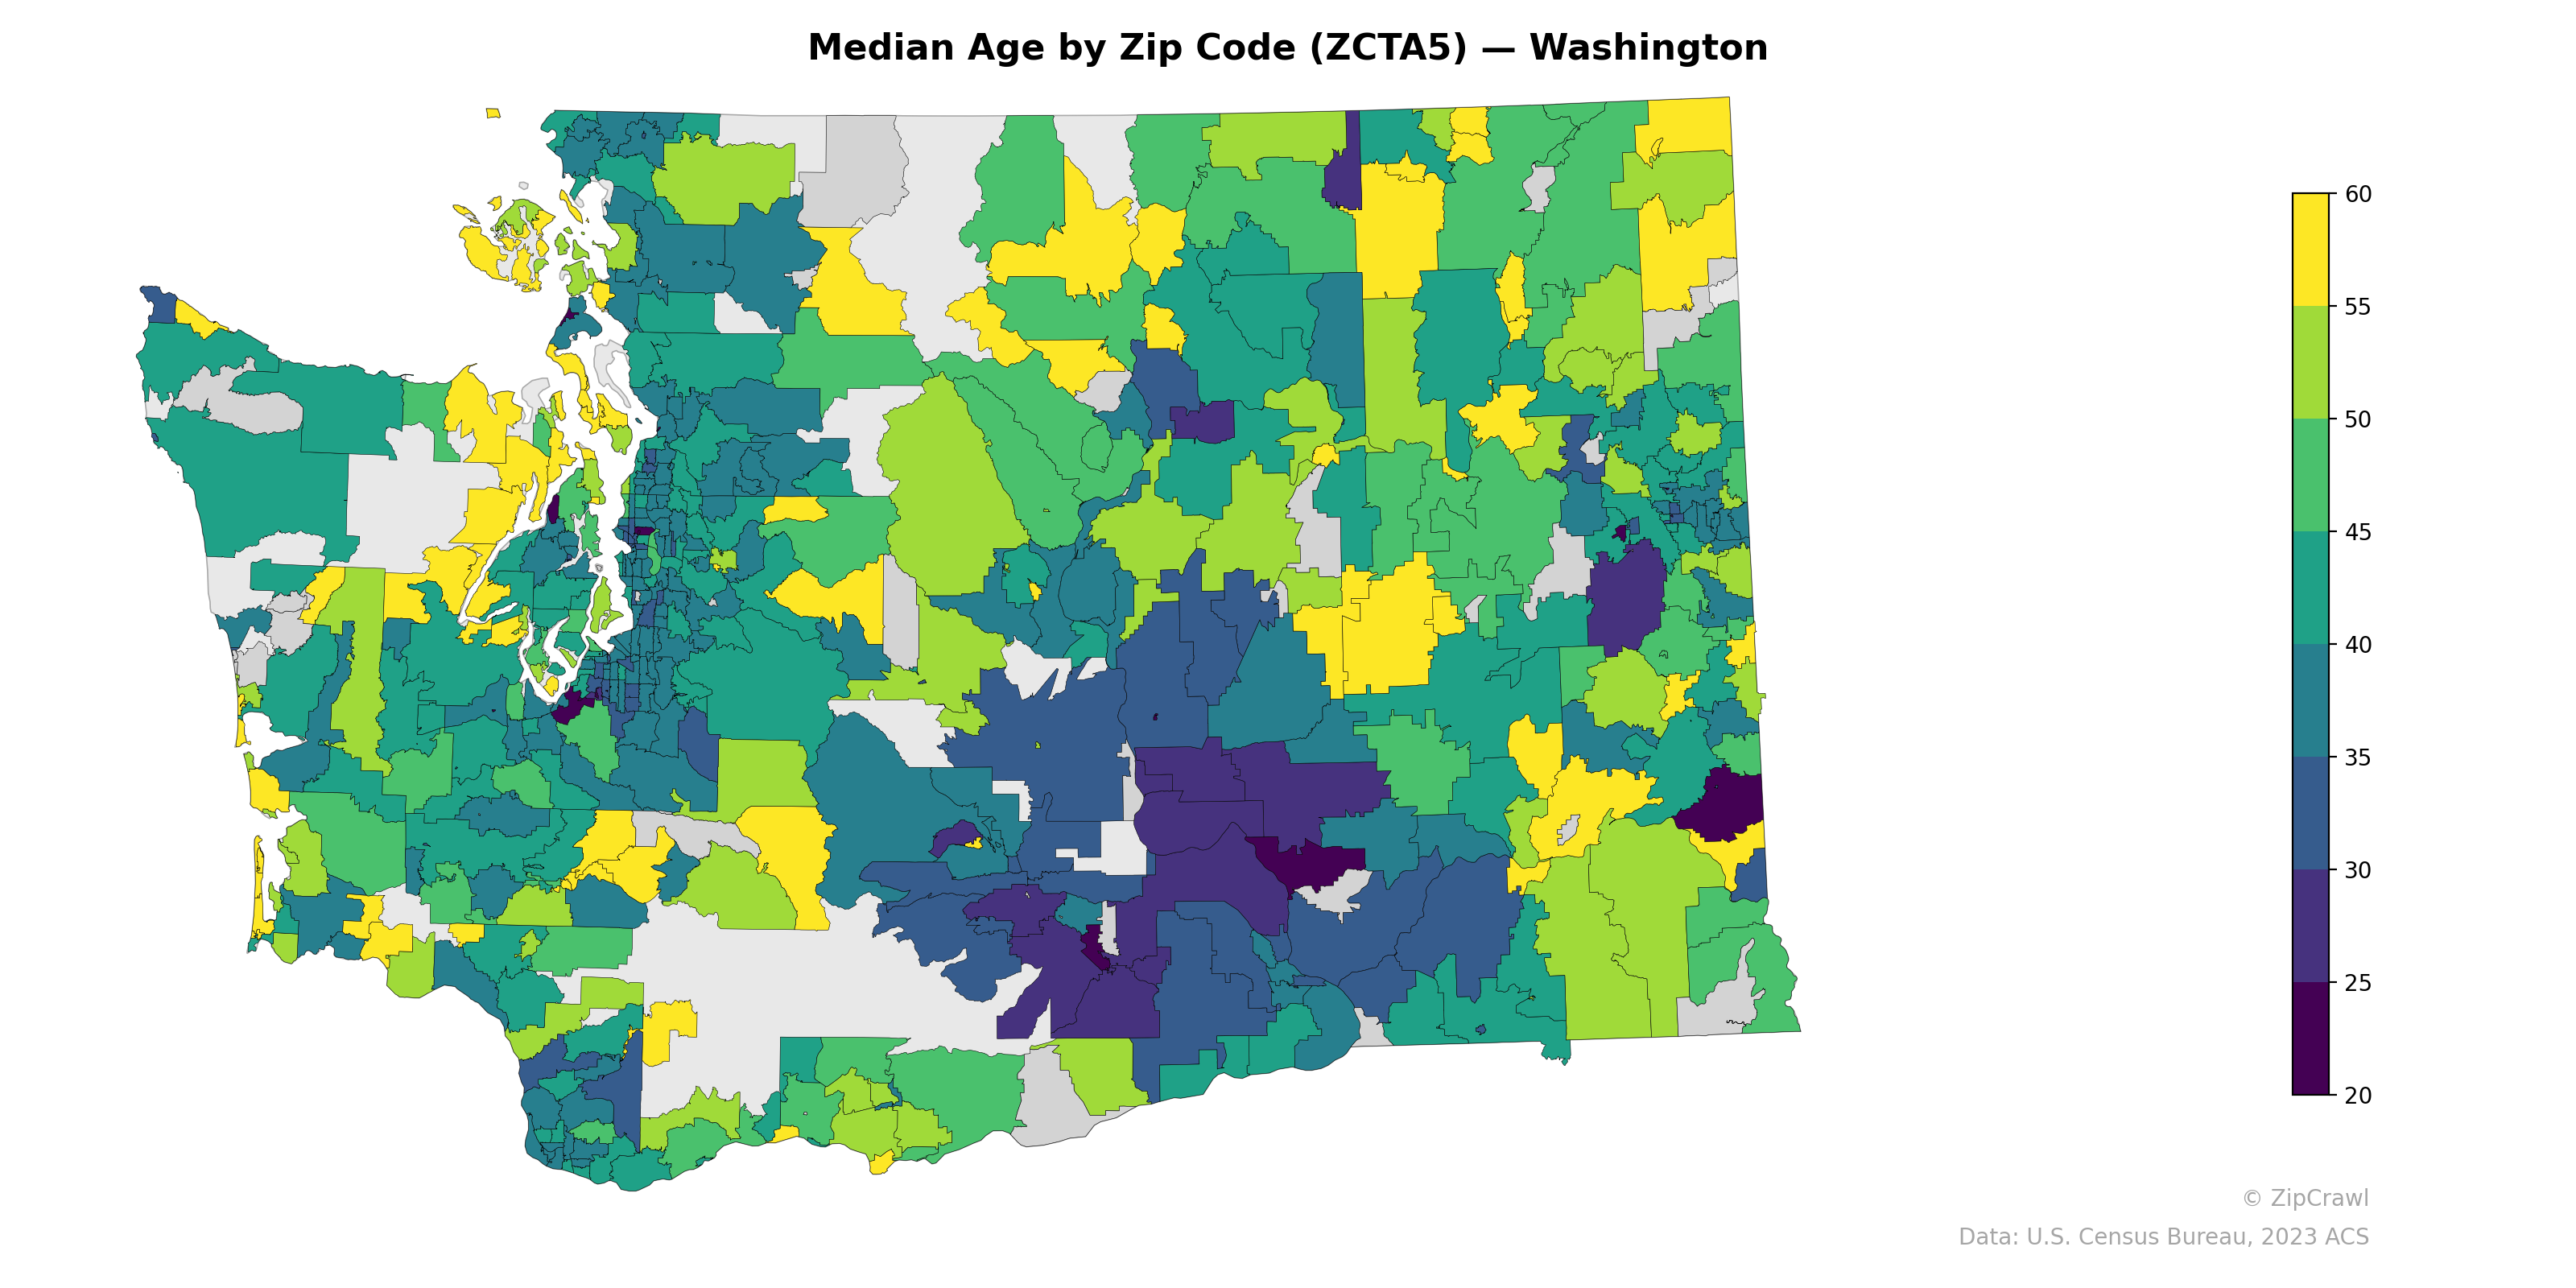
NOTE: Gray indicates insufficient data or a suppressed estimate.
University towns and military installations drive the youngest median ages in the state, with deep purple clusters visible around Pullman (WSU), Ellensburg (CWU), and the Yakima Training Center area in south-central Washington, where median ages dip below 25. The Seattle-Tacoma metro corridor displays moderate median ages in the 30s–low 40s, contrasting sharply with the yellow-shaded rural and retirement-oriented zip codes along the San Juan Islands, parts of the Olympic Peninsula coast, and scattered agricultural communities in north-central Washington where median ages exceed 55. Eastern Washington exhibits the greatest intra-regional variability, with college-town zip codes sitting immediately adjacent to aging rural communities, creating a patchwork of extremes not seen in the more uniformly moderate western urban core.
Data: U.S. Census Bureau, 2023 ACS
Explore
- Population Hispanic % by Zip Code (ZCTA5) — Los Angeles Metro
- Population Non-Hispanic Asian % by Zip Code (ZCTA5) — Virginia
- U.S. Citizens (% of Population Over 18) by Zip Code (ZCTA5) — Washington
- Population Non-Hispanic White % by Zip Code (ZCTA5) — Washington
- Population Non-Hispanic Black % by Zip Code (ZCTA5) — Washington
- Household Median Income by Zip Code (ZCTA5) — Washington
- Population Non-Hispanic American Indian % by Zip Code (ZCTA5) — Washington
- % of Population on Food Stamps or SNAP (Last 12 Months), by Zip Code (ZCTA5) — Virginia
- High School Graduate (% of Over 25) by Zip Code (ZCTA5) — Washington
- Population Hispanic % by Zip Code (ZCTA5) — Washington
- % of Population without Health Insurance, by Zip Code (ZCTA5) — Maine
- Population Hispanic % by County
- Population Non-Hispanic American Indian % by Zip Code (ZCTA5) — Los Angeles Metro
- High School Graduate (% of Over 25) by Zip Code (ZCTA5) — Los Angeles Metro
- % of Population on Food Stamps or SNAP (Last 12 Months), by Zip Code (ZCTA5) — New York Metro
- U.S. Citizens (% of Population Over 18) by Zip Code (ZCTA5) — Los Angeles Metro
- Household Median Income by Zip Code (ZCTA5) — Los Angeles Metro
- Population Non-Hispanic Black % by Zip Code (ZCTA5) — Los Angeles Metro
- Population Non-Hispanic White % by Zip Code (ZCTA5) — Los Angeles Metro
- Married Couple (% of all Households) by Zip Code (ZCTA5) — Virginia
- Housing % of Units Built Since 2010, by Zip Code (ZCTA5) — Virginia
- Housing Vacancy Rate by Zip Code (ZCTA5) — Virginia
- Bachelor's Degree or Higher (% of Over 25) by Zip Code (ZCTA5) — Virginia
- % of Population without Health Insurance, by Zip Code (ZCTA5) — Virginia
- Population Non-Hispanic American Indian % by Zip Code (ZCTA5) — Virginia
- % of Households with Broadband Internet, by Zip Code (ZCTA5) — Virginia
- Housing Owner-Occupied Median Value ($), by Zip Code (ZCTA5) — Virginia
- Housing Median Monthly Rent ($), by Zip Code (ZCTA5) — Virginia
- Household Average Size by Zip Code (ZCTA5) — Virginia
- High School Graduate (% of Over 25) by Zip Code (ZCTA5) — Virginia
- Median Age by Zip Code (ZCTA5) — Washington D.C.
- Median Age by Zip Code (ZCTA5) — Washington D.C. Metro
- Median Age by Zip Code (ZCTA5) — Wyoming
- Median Age by Zip Code (ZCTA5) — Oregon
- Median Age by Zip Code (ZCTA5) — Boston Metro
- Median Age by Zip Code (ZCTA5) — Iowa
- Median Age by Zip Code (ZCTA5) — Utah
- Median Age by Zip Code (ZCTA5) — Maine
- Median Age by Zip Code (ZCTA5) — Ohio
- Median Age by Zip Code (ZCTA5) — Texas