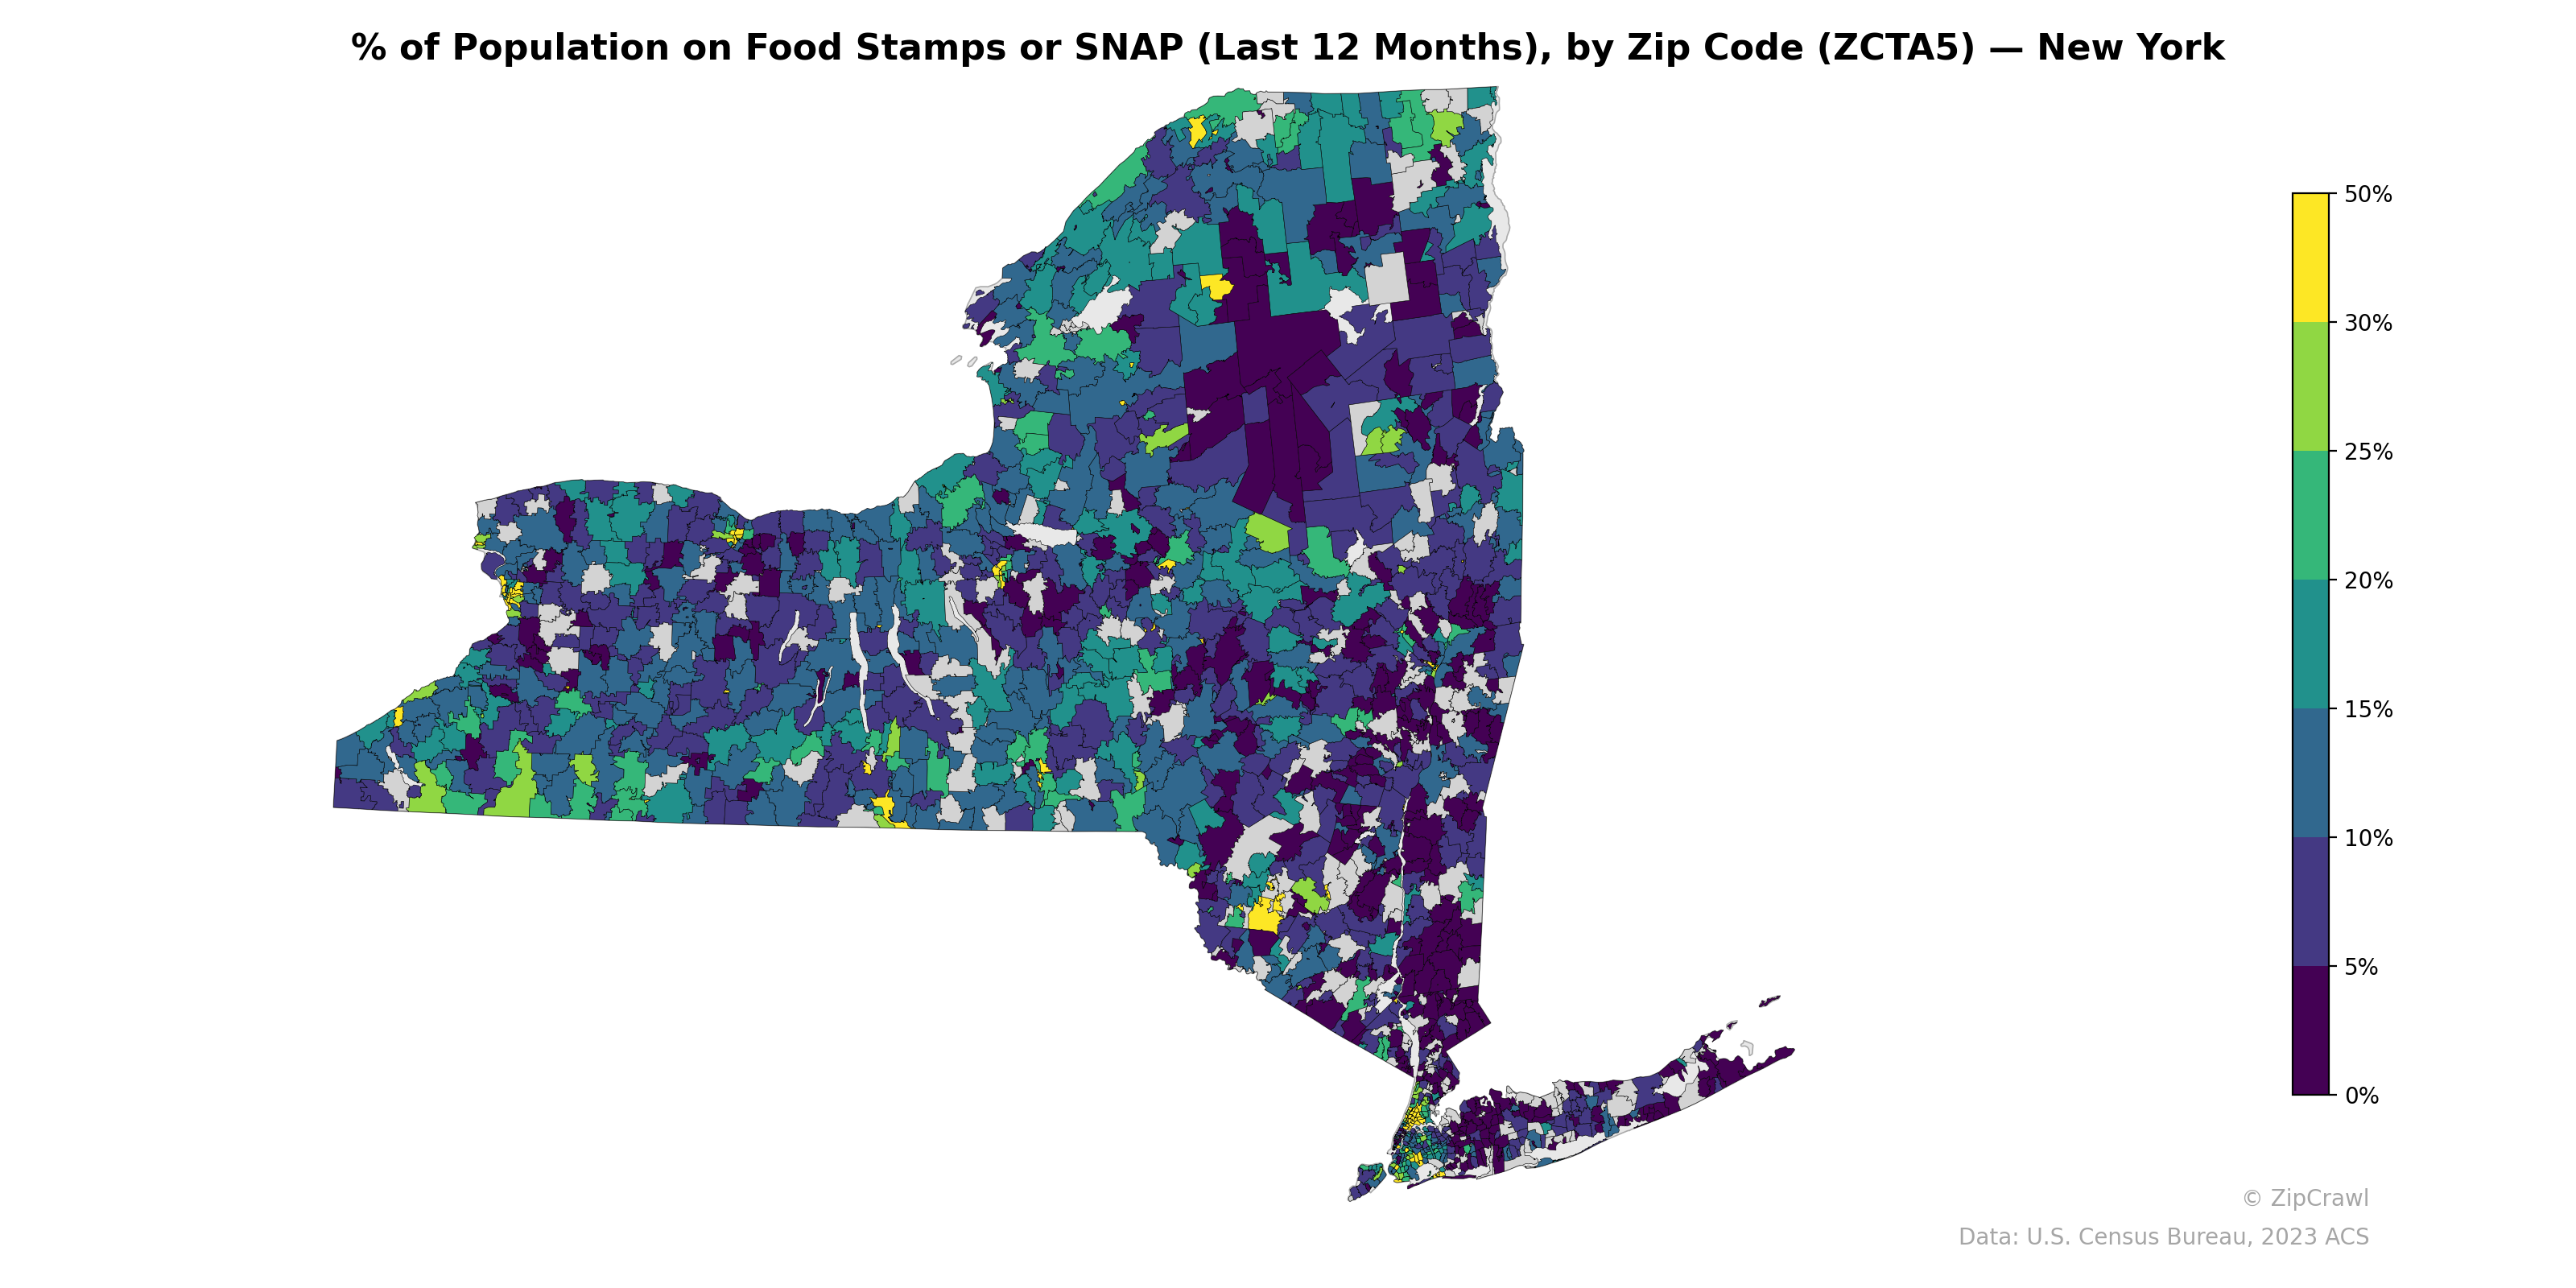
NOTE: Gray indicates insufficient data or a suppressed estimate.
Urban centers such as New York City, Buffalo, Rochester, Syracuse, and Albany exhibit notably higher SNAP participation rates, with many zip codes reaching 25–50%, reflecting concentrated poverty and higher cost-of-living pressures in those metro areas. Suburban and exurban zip codes across Long Island, the Hudson Valley, and the Finger Lakes region generally fall below 10%, creating sharp contrasts with adjacent urban cores. Northern New York, including parts of the Adirondack region and the St. Lawrence Valley, displays a patchwork of moderate-to-high participation rates (15–30%), suggesting persistent rural economic challenges distinct from the downstate suburban affluence.
Data: U.S. Census Bureau, 2023 ACS
Explore
- Population Non-Hispanic Black % by Zip Code (ZCTA5) — Wyoming
- Married Couple (% of all Households) by Zip Code (ZCTA5) — Vermont
- High School Graduate (% of Over 25) by Zip Code (ZCTA5) — Oregon
- Household Median Income by Zip Code (ZCTA5) — Wyoming
- Median Age by Zip Code (ZCTA5) — Wyoming
- Housing Vacancy Rate by Zip Code (ZCTA5) — Vermont
- Population Hispanic % by Zip Code (ZCTA5) — Wyoming
- Population Non-Hispanic White % by Zip Code (ZCTA5) — Wyoming
- U.S. Citizens (% of Population Over 18) by Zip Code (ZCTA5) — Wyoming
- Population Non-Hispanic Asian % by Zip Code (ZCTA5) — Vermont
- Married Couple (% of all Households) by County
- Population Non-Hispanic White % by Zip Code (ZCTA5) — Illinois
- High School Graduate (% of Over 25) by Zip Code (ZCTA5) — Illinois
- Population Hispanic % by Zip Code (ZCTA5) — Illinois
- Median Age by Zip Code (ZCTA5) — Illinois
- Population Non-Hispanic Black % by Zip Code (ZCTA5) — Illinois
- Population Non-Hispanic American Indian % by Zip Code (ZCTA5) — Illinois
- Population Non-Hispanic Asian % by Zip Code (ZCTA5) — New York
- U.S. Citizens (% of Population Over 18) by Zip Code (ZCTA5) — Illinois
- Household Median Income by Zip Code (ZCTA5) — Illinois
- Household Average Size by Zip Code (ZCTA5) — Vermont
- High School Graduate (% of Over 25) by Zip Code (ZCTA5) — North Dakota
- Population Non-Hispanic American Indian % by Zip Code (ZCTA5) — Vermont
- Population Hispanic % by Zip Code (ZCTA5) — Washington D.C.
- High School Graduate (% of Over 25) by Zip Code (ZCTA5) — Nevada
- Bachelor's Degree or Higher (% of Over 25) by Zip Code (ZCTA5) — Vermont
- High School Graduate (% of Over 25) by Zip Code (ZCTA5) — Nebraska
- High School Graduate (% of Over 25) by Zip Code (ZCTA5) — Maine
- High School Graduate (% of Over 25) by Zip Code (ZCTA5) — Vermont
- Housing % of Units Built Since 2010, by Zip Code (ZCTA5) — Vermont
- % of Population on Food Stamps or SNAP (Last 12 Months), by Zip Code (ZCTA5) — New York Metro
- % of Population on Food Stamps or SNAP (Last 12 Months), by Zip Code (ZCTA5) — New Mexico
- % of Population on Food Stamps or SNAP (Last 12 Months), by Zip Code (ZCTA5) — New Jersey
- % of Population on Food Stamps or SNAP (Last 12 Months), by Zip Code (ZCTA5) — Nevada
- % of Population on Food Stamps or SNAP (Last 12 Months), by Zip Code (ZCTA5) — New Hampshire
- % of Population on Food Stamps or SNAP (Last 12 Months), by Zip Code (ZCTA5) — Ohio
- % of Population on Food Stamps or SNAP (Last 12 Months), by Zip Code (ZCTA5) — Montana
- % of Population on Food Stamps or SNAP (Last 12 Months), by Zip Code (ZCTA5) — Oregon
- % of Population on Food Stamps or SNAP (Last 12 Months), by Zip Code (ZCTA5) — Nebraska
- % of Population on Food Stamps or SNAP (Last 12 Months), by Zip Code (ZCTA5) — Iowa