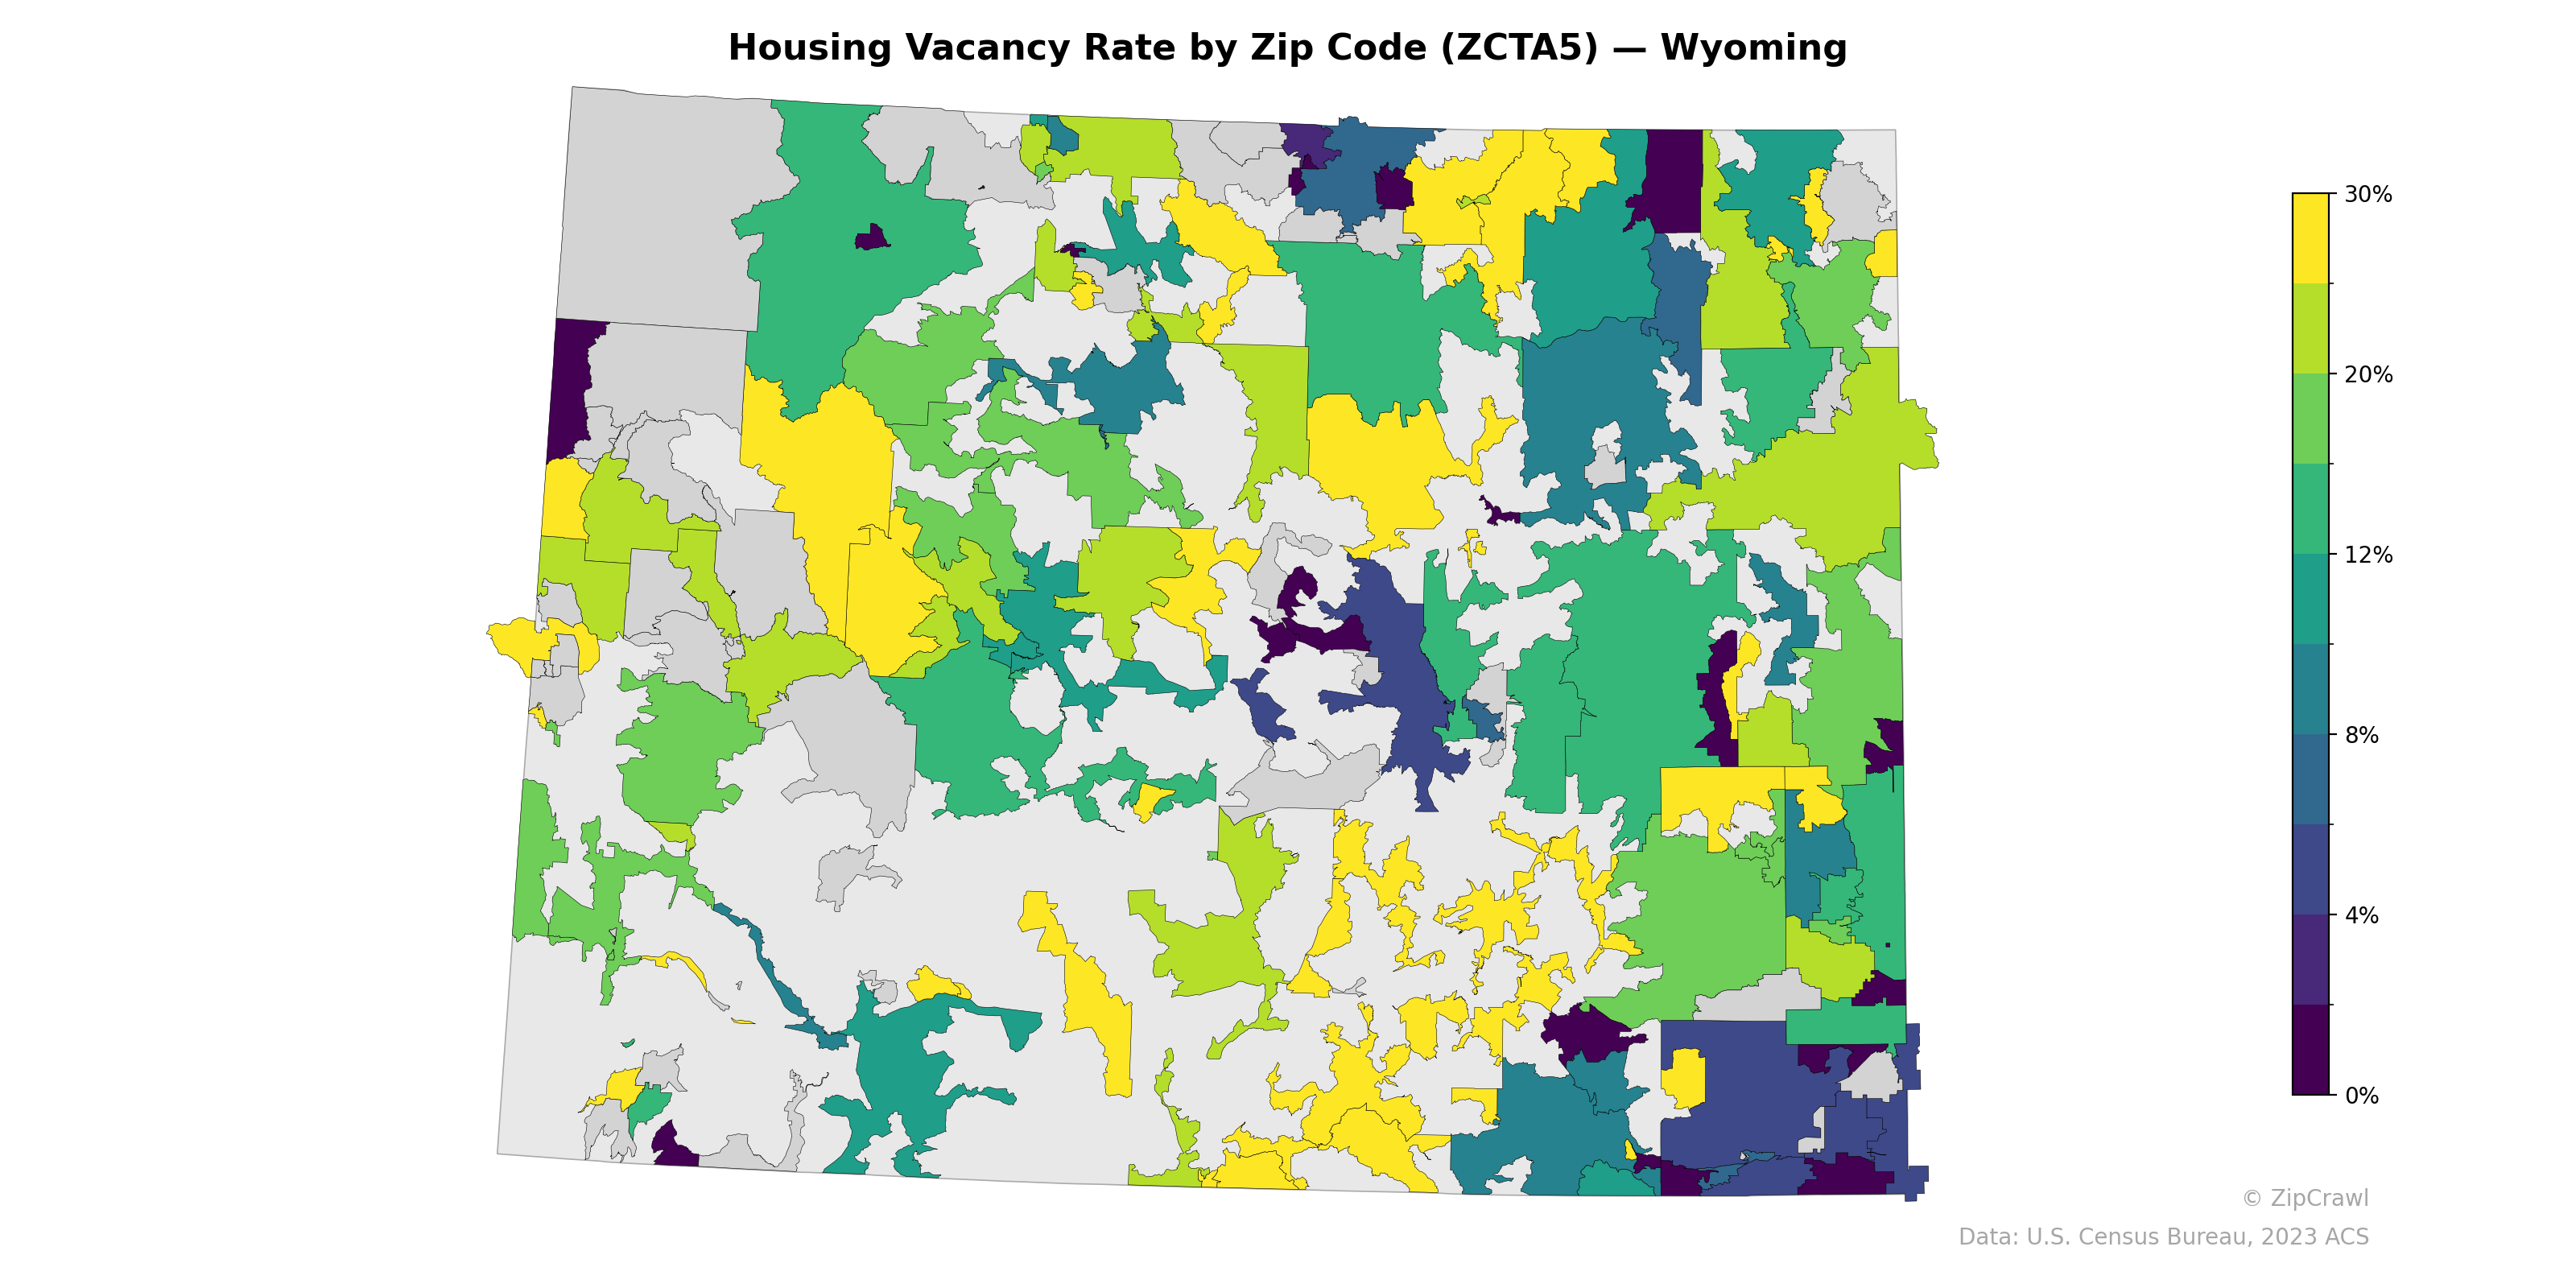
NOTE: Gray indicates insufficient data or a suppressed estimate.
Housing vacancy rates across Wyoming exhibit substantial spatial variation, with the highest rates (20–30%+) concentrated in the north-central region and scattered rural zip codes, likely reflecting seasonal or recreational housing stock near areas such as the Bighorn Mountains and parts of the Wind River range. The central corridor running roughly through Natrona and Converse counties displays notably low vacancy rates (0–4%), consistent with more urbanized areas like Casper where housing demand remains relatively tight. The southeastern corner near Cheyenne and Laramie shows a mixed pattern of moderate-to-low vacancy, while the western border zip codes trend toward mid-range rates (8–16%), possibly influenced by energy-sector housing dynamics.
Data: U.S. Census Bureau, 2023 ACS
Explore
- Household Median Income by Zip Code (ZCTA5) — Illinois
- Population Non-Hispanic White % by Zip Code (ZCTA5) — Washington D.C.
- U.S. Citizens (% of Population Over 18) by Zip Code (ZCTA5) — Washington D.C.
- Married Couple (% of all Households) by Zip Code (ZCTA5) — Wyoming
- Population Hispanic % by Zip Code (ZCTA5) — Washington D.C.
- Population Non-Hispanic Black % by Zip Code (ZCTA5) — Washington D.C.
- Population Non-Hispanic Asian % by Zip Code (ZCTA5) — Wyoming
- Household Median Income by Zip Code (ZCTA5) — Washington D.C.
- % of Population on Food Stamps or SNAP (Last 12 Months), by Zip Code (ZCTA5) — Wyoming
- Median Age by Zip Code (ZCTA5) — Washington D.C.
- Married Couple (% of all Households) by County
- % of Households with Broadband Internet, by Zip Code (ZCTA5) — San Francisco Metro
- Population Non-Hispanic American Indian % by Zip Code (ZCTA5) — Illinois
- High School Graduate (% of Over 25) by Zip Code (ZCTA5) — Illinois
- Population Non-Hispanic White % by Zip Code (ZCTA5) — Illinois
- Median Age by Zip Code (ZCTA5) — Illinois
- Population Hispanic % by Zip Code (ZCTA5) — Illinois
- Population Non-Hispanic Asian % by Zip Code (ZCTA5) — New York
- % of Population on Food Stamps or SNAP (Last 12 Months), by Zip Code (ZCTA5) — New York
- Population Non-Hispanic Black % by Zip Code (ZCTA5) — Illinois
- U.S. Citizens (% of Population Over 18) by Zip Code (ZCTA5) — Illinois
- % of Households with Broadband Internet, by Zip Code (ZCTA5) — Florida
- Married Couple (% of all Households) by Zip Code (ZCTA5) — Vermont
- % of Households with Broadband Internet, by Zip Code (ZCTA5) — Vermont
- Population Non-Hispanic Asian % by Zip Code (ZCTA5) — Vermont
- % of Population without Health Insurance, by Zip Code (ZCTA5) — Vermont
- Population Non-Hispanic American Indian % by Zip Code (ZCTA5) — Vermont
- High School Graduate (% of Over 25) by Zip Code (ZCTA5) — Vermont
- Bachelor's Degree or Higher (% of Over 25) by Zip Code (ZCTA5) — Vermont
- % of Households with Broadband Internet, by Zip Code (ZCTA5) — Oregon
- Housing Vacancy Rate by Zip Code (ZCTA5) — Iowa
- Housing Vacancy Rate by Zip Code (ZCTA5) — Ohio
- Housing Vacancy Rate by Zip Code (ZCTA5) — Utah
- Housing Vacancy Rate by Zip Code (ZCTA5) — Maine
- Housing Vacancy Rate by Zip Code (ZCTA5) — Hawaii
- Housing Vacancy Rate by Zip Code (ZCTA5) — Idaho
- Housing Vacancy Rate by Zip Code (ZCTA5) — Texas
- Housing Vacancy Rate by Zip Code (ZCTA5) — Wisconsin
- Housing Vacancy Rate by Zip Code (ZCTA5) — Oregon
- Housing Vacancy Rate by Zip Code (ZCTA5) — Colorado