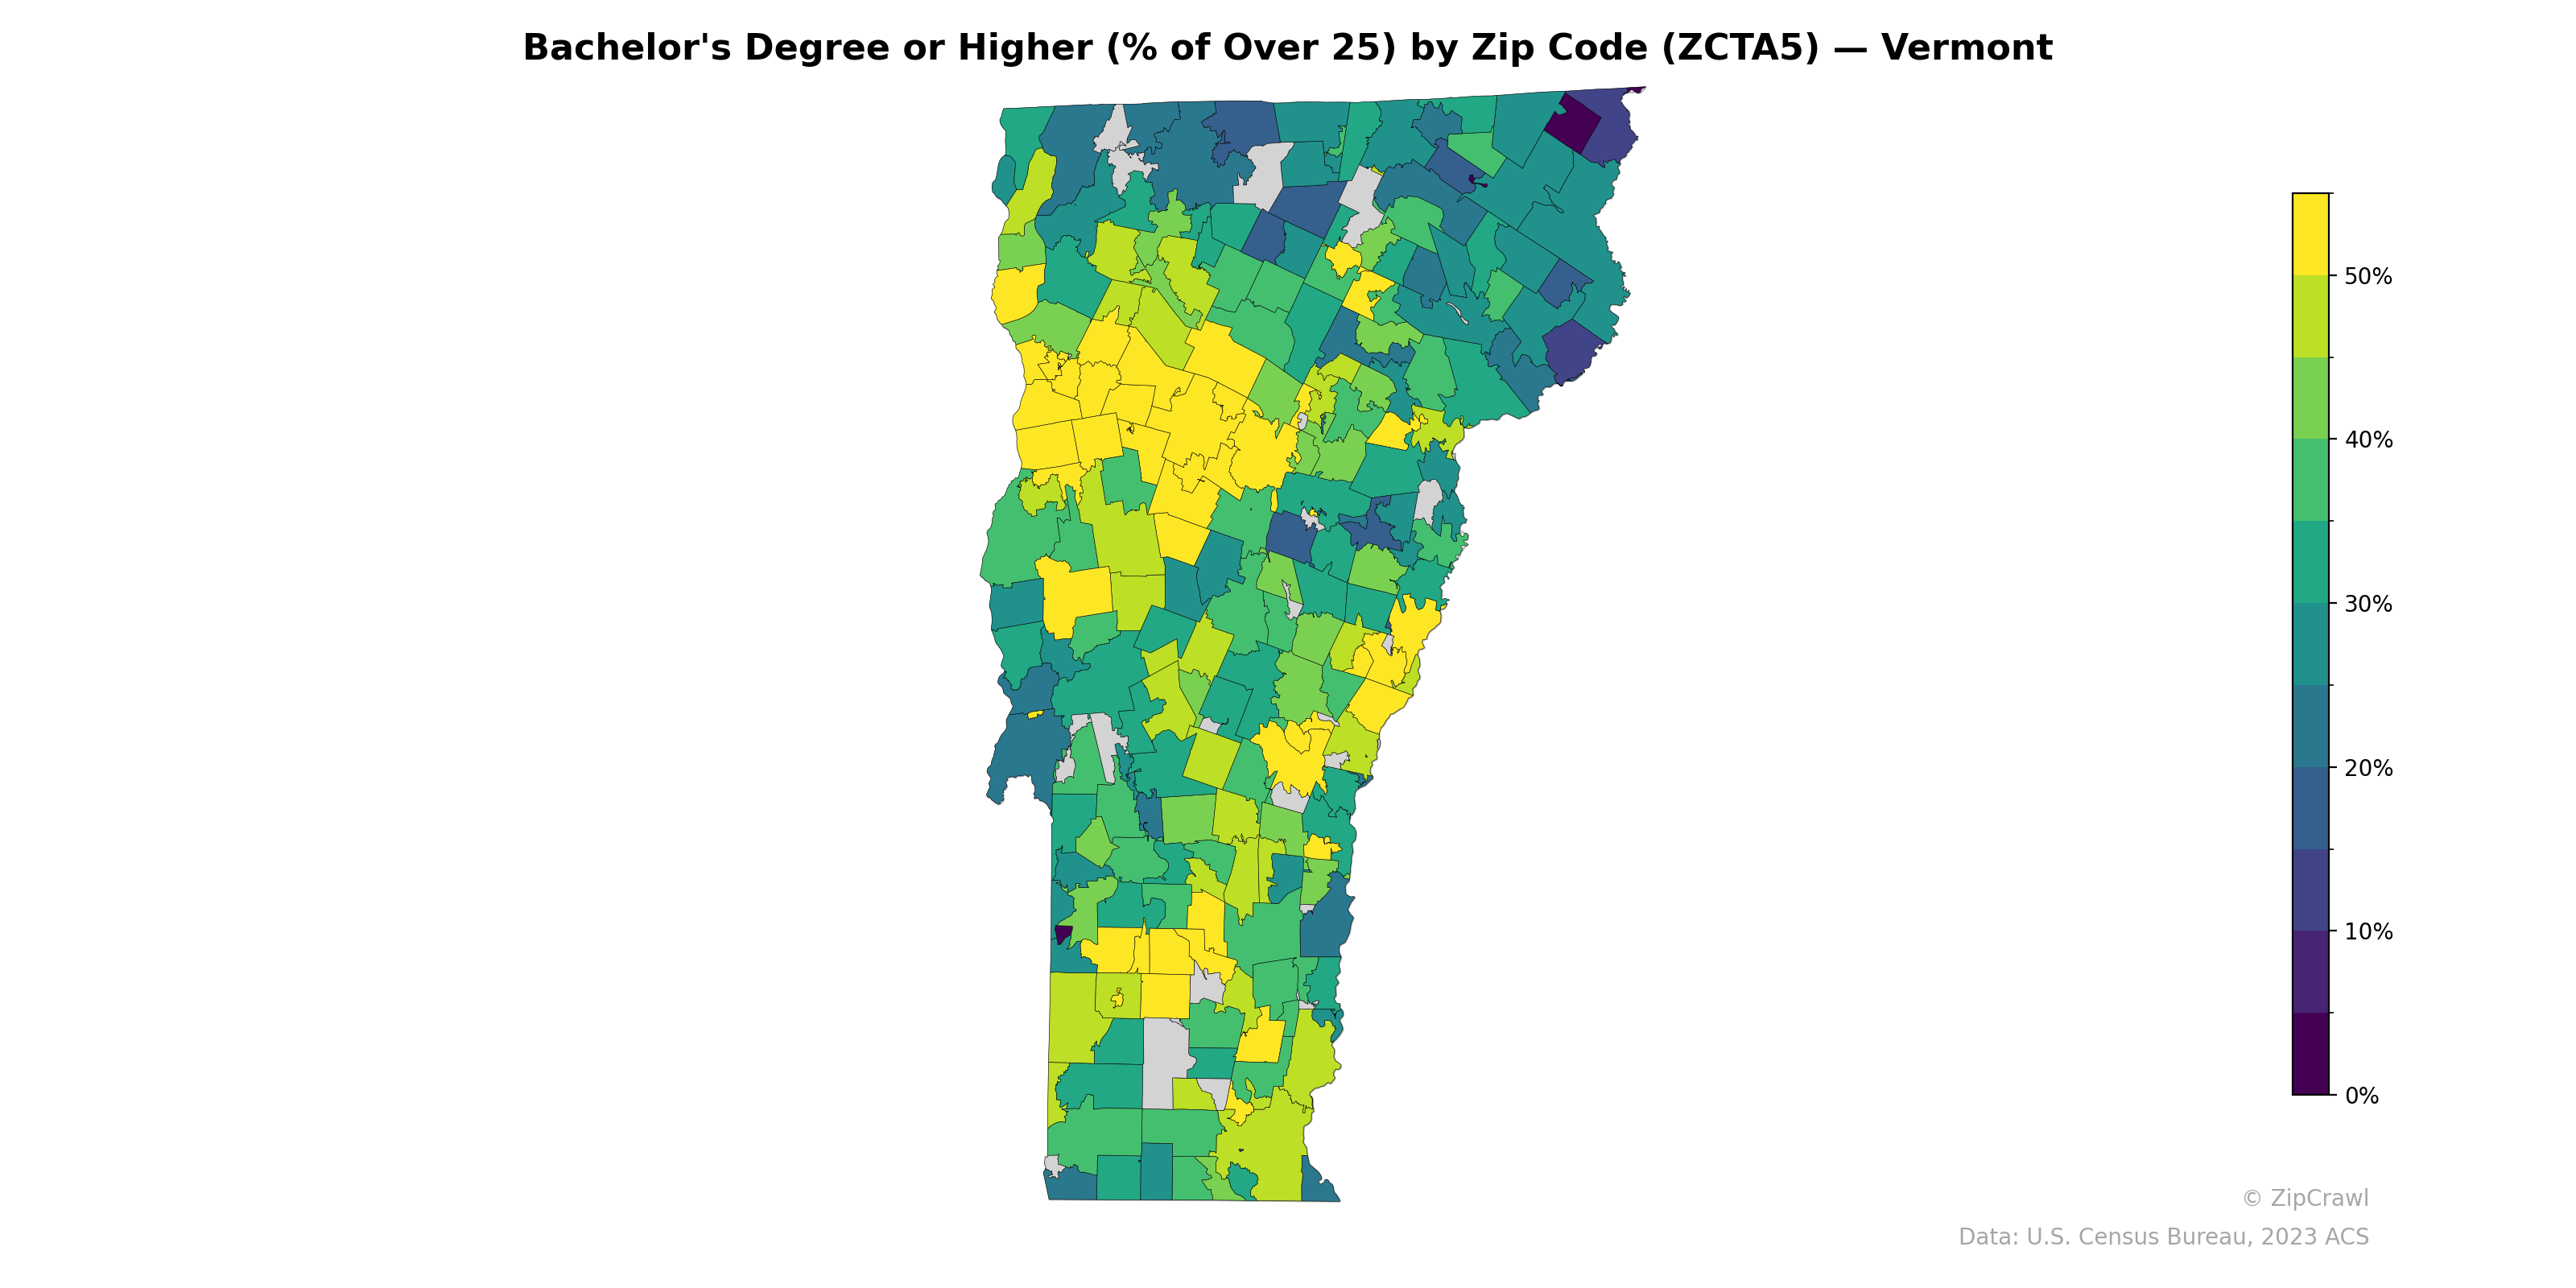
NOTE: Gray indicates insufficient data or a suppressed estimate.
The Burlington metropolitan area in northwestern Vermont stands out as a prominent cluster of high bachelor's degree attainment, with several zip codes exceeding 50%, likely reflecting the influence of the University of Vermont and associated economic opportunities. A secondary corridor of elevated educational attainment runs through central Vermont, particularly around the Montpelier-Barre area and extending southward through the Upper Valley region near the New Hampshire border. The Northeast Kingdom and portions of the rural northern tier consistently register among the lowest rates in the state, generally falling below 20%, highlighting a persistent urban-rural education gap across Vermont.
Data: U.S. Census Bureau, 2023 ACS
Explore
- Population Non-Hispanic Asian % by Zip Code (ZCTA5) — New York
- % of Population without Health Insurance, by Zip Code (ZCTA5) — Vermont
- % of Households with Broadband Internet, by Zip Code (ZCTA5) — Vermont
- Household Average Size by Zip Code (ZCTA5) — Vermont
- Housing Median Monthly Rent ($), by Zip Code (ZCTA5) — Vermont
- High School Graduate (% of Over 25) by Zip Code (ZCTA5) — Vermont
- Housing % of Units Built Since 2010, by Zip Code (ZCTA5) — Vermont
- Housing Owner-Occupied Median Value ($), by Zip Code (ZCTA5) — Vermont
- Population Non-Hispanic American Indian % by Zip Code (ZCTA5) — Vermont
- Housing Owner-Occupied % of Units, by Zip Code (ZCTA5) — Vermont
- Married Couple (% of all Households) by County
- Population Non-Hispanic Black % by Zip Code (ZCTA5) — Illinois
- High School Graduate (% of Over 25) by Zip Code (ZCTA5) — Illinois
- Population Non-Hispanic American Indian % by Zip Code (ZCTA5) — Illinois
- U.S. Citizens (% of Population Over 18) by Zip Code (ZCTA5) — Boston Metro
- Median Age by Zip Code (ZCTA5) — Illinois
- Household Median Income by Zip Code (ZCTA5) — Illinois
- Population Non-Hispanic White % by Zip Code (ZCTA5) — Illinois
- % of Population on Food Stamps or SNAP (Last 12 Months), by Zip Code (ZCTA5) — New York
- U.S. Citizens (% of Population Over 18) by Zip Code (ZCTA5) — Illinois
- Population Hispanic % by Zip Code (ZCTA5) — Illinois
- U.S. Citizens (% of Population Over 18) by Zip Code (ZCTA5) — California
- Population Non-Hispanic American Indian % by Zip Code (ZCTA5) — Oregon
- Population Non-Hispanic Asian % by Zip Code (ZCTA5) — Vermont
- Population Hispanic % by Zip Code (ZCTA5) — Washington D.C.
- Housing Vacancy Rate by Zip Code (ZCTA5) — Vermont
- % of Population on Food Stamps or SNAP (Last 12 Months), by Zip Code (ZCTA5) — Vermont
- Married Couple (% of all Households) by Zip Code (ZCTA5) — Vermont
- U.S. Citizens (% of Population Over 18) by Zip Code (ZCTA5) — Wyoming
- Household Median Income by Zip Code (ZCTA5) — Wyoming
- Bachelor's Degree or Higher (% of Over 25) by Zip Code (ZCTA5) — Montana
- Bachelor's Degree or Higher (% of Over 25) by Zip Code (ZCTA5) — Ohio
- Bachelor's Degree or Higher (% of Over 25) by Zip Code (ZCTA5) — Iowa
- Bachelor's Degree or Higher (% of Over 25) by Zip Code (ZCTA5) — Utah
- Bachelor's Degree or Higher (% of Over 25) by Zip Code (ZCTA5) — Oregon
- Bachelor's Degree or Higher (% of Over 25) by Zip Code (ZCTA5) — Hawaii
- Bachelor's Degree or Higher (% of Over 25) by Zip Code (ZCTA5) — Colorado
- Bachelor's Degree or Higher (% of Over 25) by Zip Code (ZCTA5) — Texas
- Bachelor's Degree or Higher (% of Over 25) by Zip Code (ZCTA5) — Idaho
- Bachelor's Degree or Higher (% of Over 25) by Zip Code (ZCTA5) — Maine