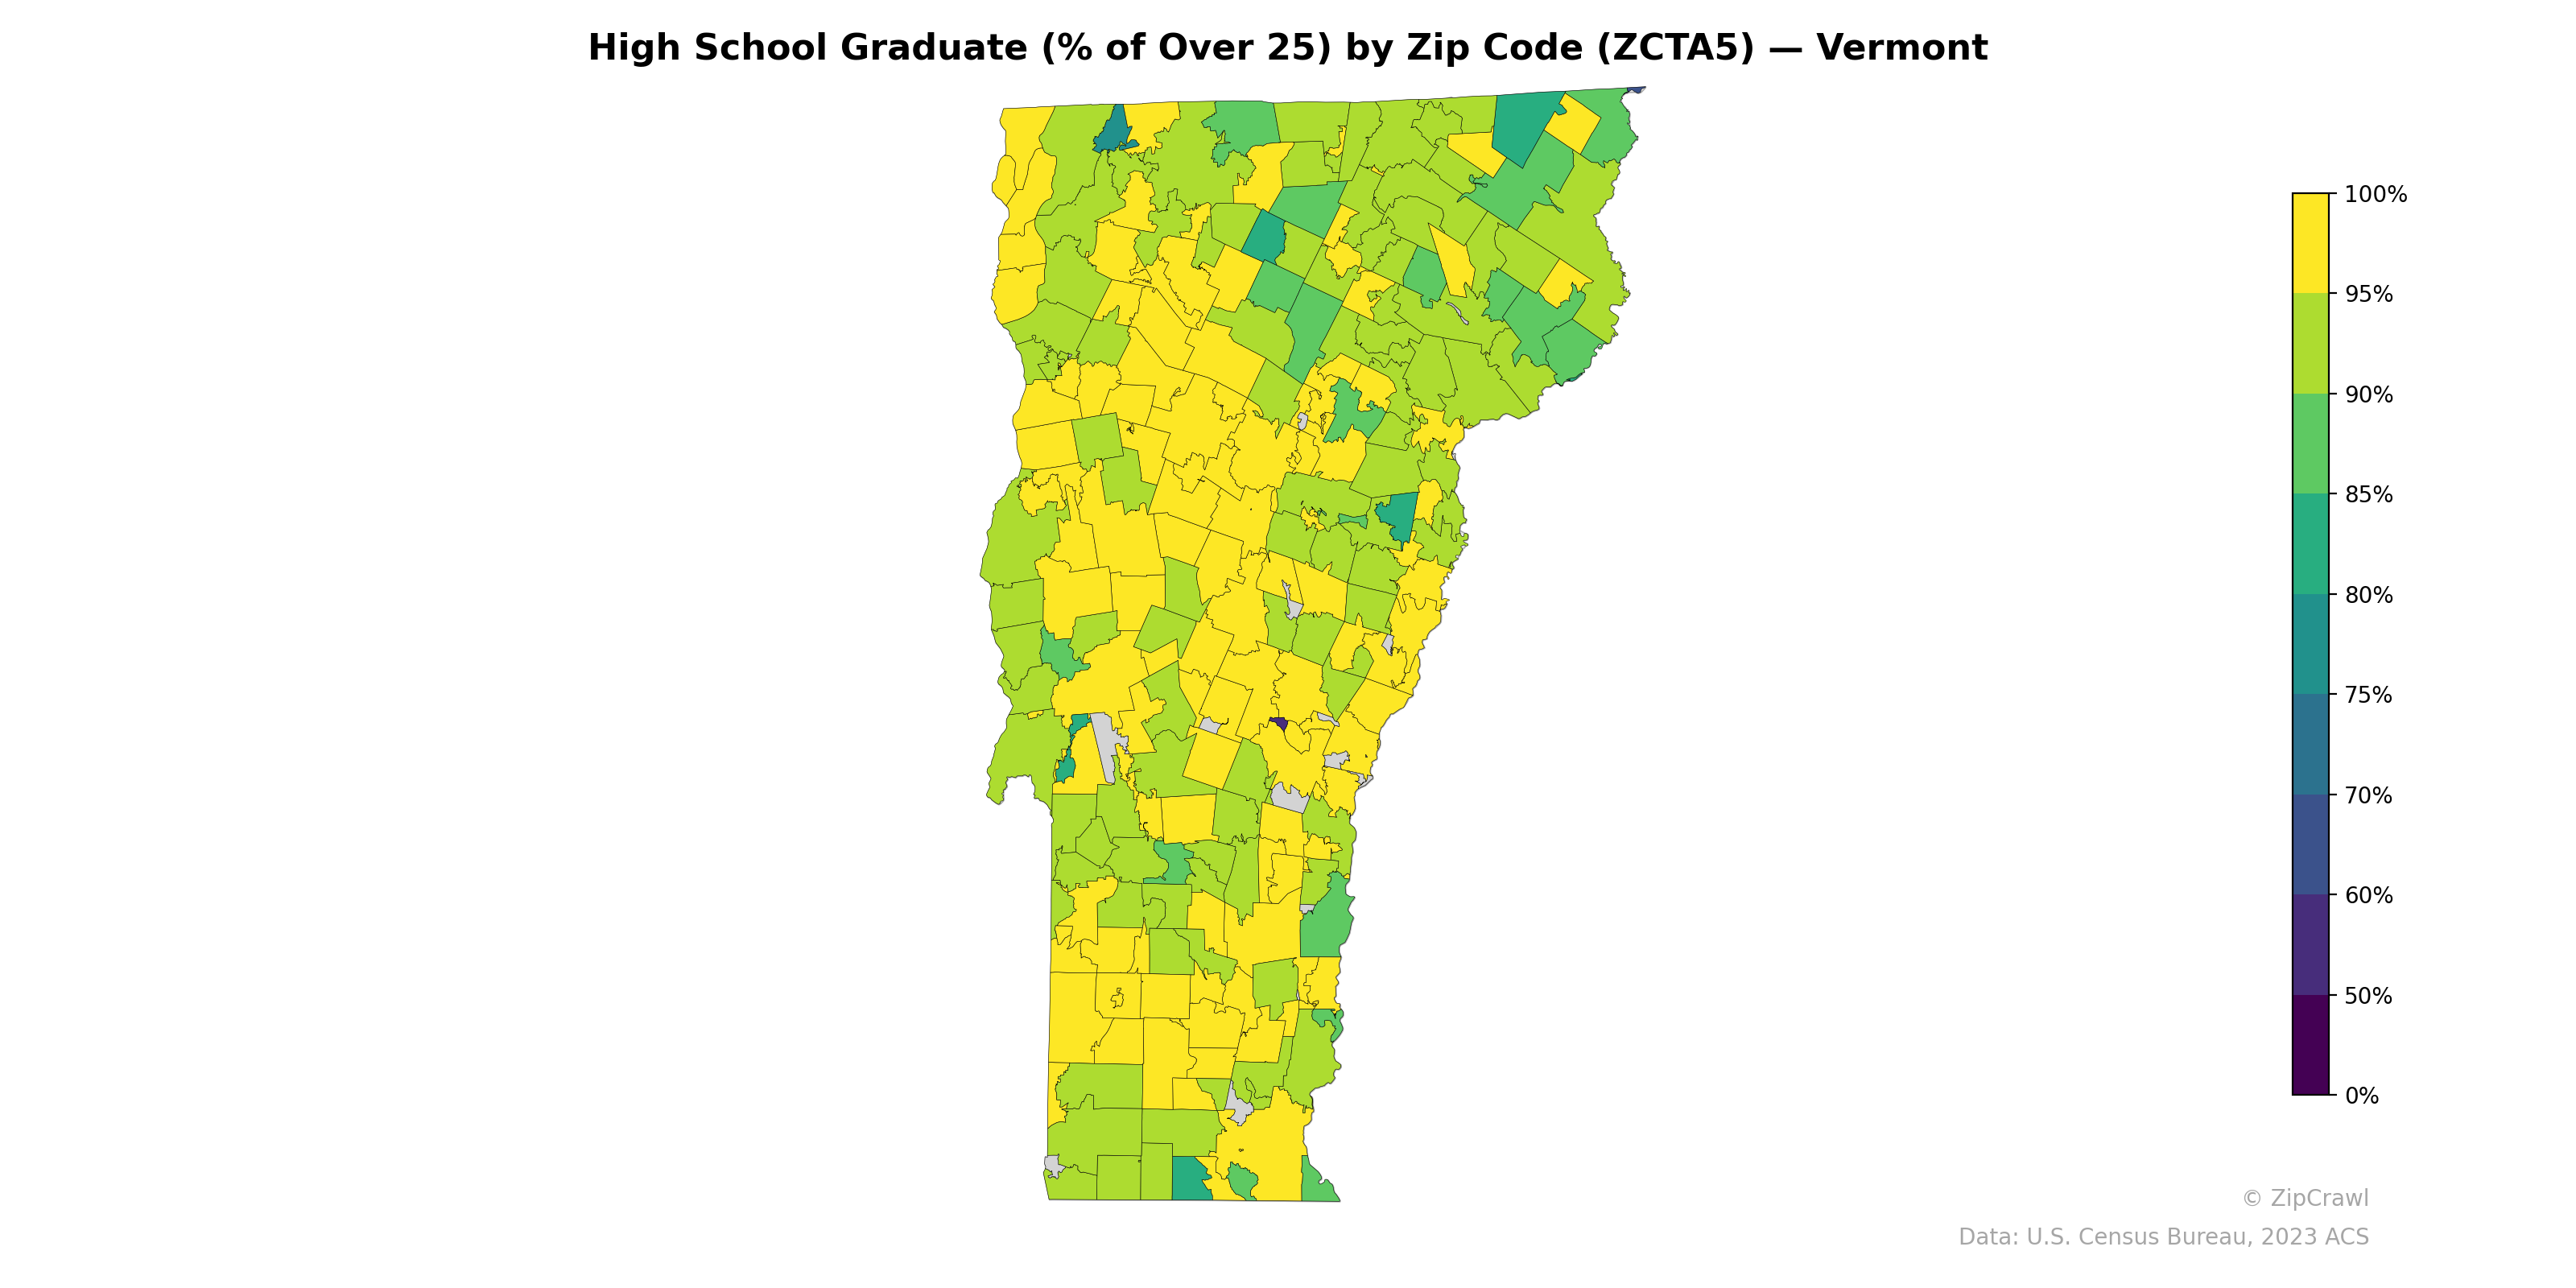
NOTE: Gray indicates insufficient data or a suppressed estimate.
Most Vermont zip codes report high school graduation rates above 85%, with broad swaths of the northern and central regions displaying rates in the 90–100% range, indicated by yellow shading. A notable contrast emerges in portions of the southern tier and along the eastern border, where several zip codes dip into the 75–85% range, appearing as greener tones. A small number of isolated zip codes—particularly in the south-central area near Windham County—fall below 70%, representing the state's most pronounced pockets of lower educational attainment.
Data: U.S. Census Bureau, 2023 ACS
Explore
- Population Non-Hispanic Asian % by Zip Code (ZCTA5) — New York
- % of Population without Health Insurance, by Zip Code (ZCTA5) — Vermont
- % of Households with Broadband Internet, by Zip Code (ZCTA5) — Vermont
- Housing Median Monthly Rent ($), by Zip Code (ZCTA5) — Vermont
- Household Average Size by Zip Code (ZCTA5) — Vermont
- Housing Owner-Occupied % of Units, by Zip Code (ZCTA5) — Vermont
- Housing % of Units Built Since 2010, by Zip Code (ZCTA5) — Vermont
- Bachelor's Degree or Higher (% of Over 25) by Zip Code (ZCTA5) — Vermont
- Population Non-Hispanic American Indian % by Zip Code (ZCTA5) — Vermont
- Housing Owner-Occupied Median Value ($), by Zip Code (ZCTA5) — Vermont
- Married Couple (% of all Households) by County
- % of Population on Food Stamps or SNAP (Last 12 Months), by Zip Code (ZCTA5) — Maryland
- Population Non-Hispanic American Indian % by Zip Code (ZCTA5) — Illinois
- Population Non-Hispanic Black % by Zip Code (ZCTA5) — Illinois
- Household Median Income by Zip Code (ZCTA5) — Illinois
- Median Age by Zip Code (ZCTA5) — Illinois
- U.S. Citizens (% of Population Over 18) by Zip Code (ZCTA5) — Illinois
- Population Non-Hispanic White % by Zip Code (ZCTA5) — Illinois
- % of Population on Food Stamps or SNAP (Last 12 Months), by Zip Code (ZCTA5) — Texas
- % of Population on Food Stamps or SNAP (Last 12 Months), by Zip Code (ZCTA5) — New York
- Population Hispanic % by Zip Code (ZCTA5) — Illinois
- % of Population on Food Stamps or SNAP (Last 12 Months), by Zip Code (ZCTA5) — Vermont
- Population Hispanic % by Zip Code (ZCTA5) — Washington D.C.
- Population Non-Hispanic American Indian % by Zip Code (ZCTA5) — Oregon
- Population Non-Hispanic Asian % by Zip Code (ZCTA5) — Vermont
- U.S. Citizens (% of Population Over 18) by Zip Code (ZCTA5) — Wyoming
- Married Couple (% of all Households) by Zip Code (ZCTA5) — Vermont
- Housing Vacancy Rate by Zip Code (ZCTA5) — Vermont
- Household Median Income by Zip Code (ZCTA5) — Wyoming
- Median Age by Zip Code (ZCTA5) — Wyoming
- High School Graduate (% of Over 25) by Zip Code (ZCTA5) — Montana
- High School Graduate (% of Over 25) by Zip Code (ZCTA5) — Ohio
- High School Graduate (% of Over 25) by Zip Code (ZCTA5) — Utah
- High School Graduate (% of Over 25) by Zip Code (ZCTA5) — Iowa
- High School Graduate (% of Over 25) by Zip Code (ZCTA5) — Texas
- High School Graduate (% of Over 25) by Zip Code (ZCTA5) — Colorado
- High School Graduate (% of Over 25) by Zip Code (ZCTA5) — Hawaii
- High School Graduate (% of Over 25) by Zip Code (ZCTA5) — Oregon
- High School Graduate (% of Over 25) by Zip Code (ZCTA5) — Idaho
- High School Graduate (% of Over 25) by Zip Code (ZCTA5) — Maine