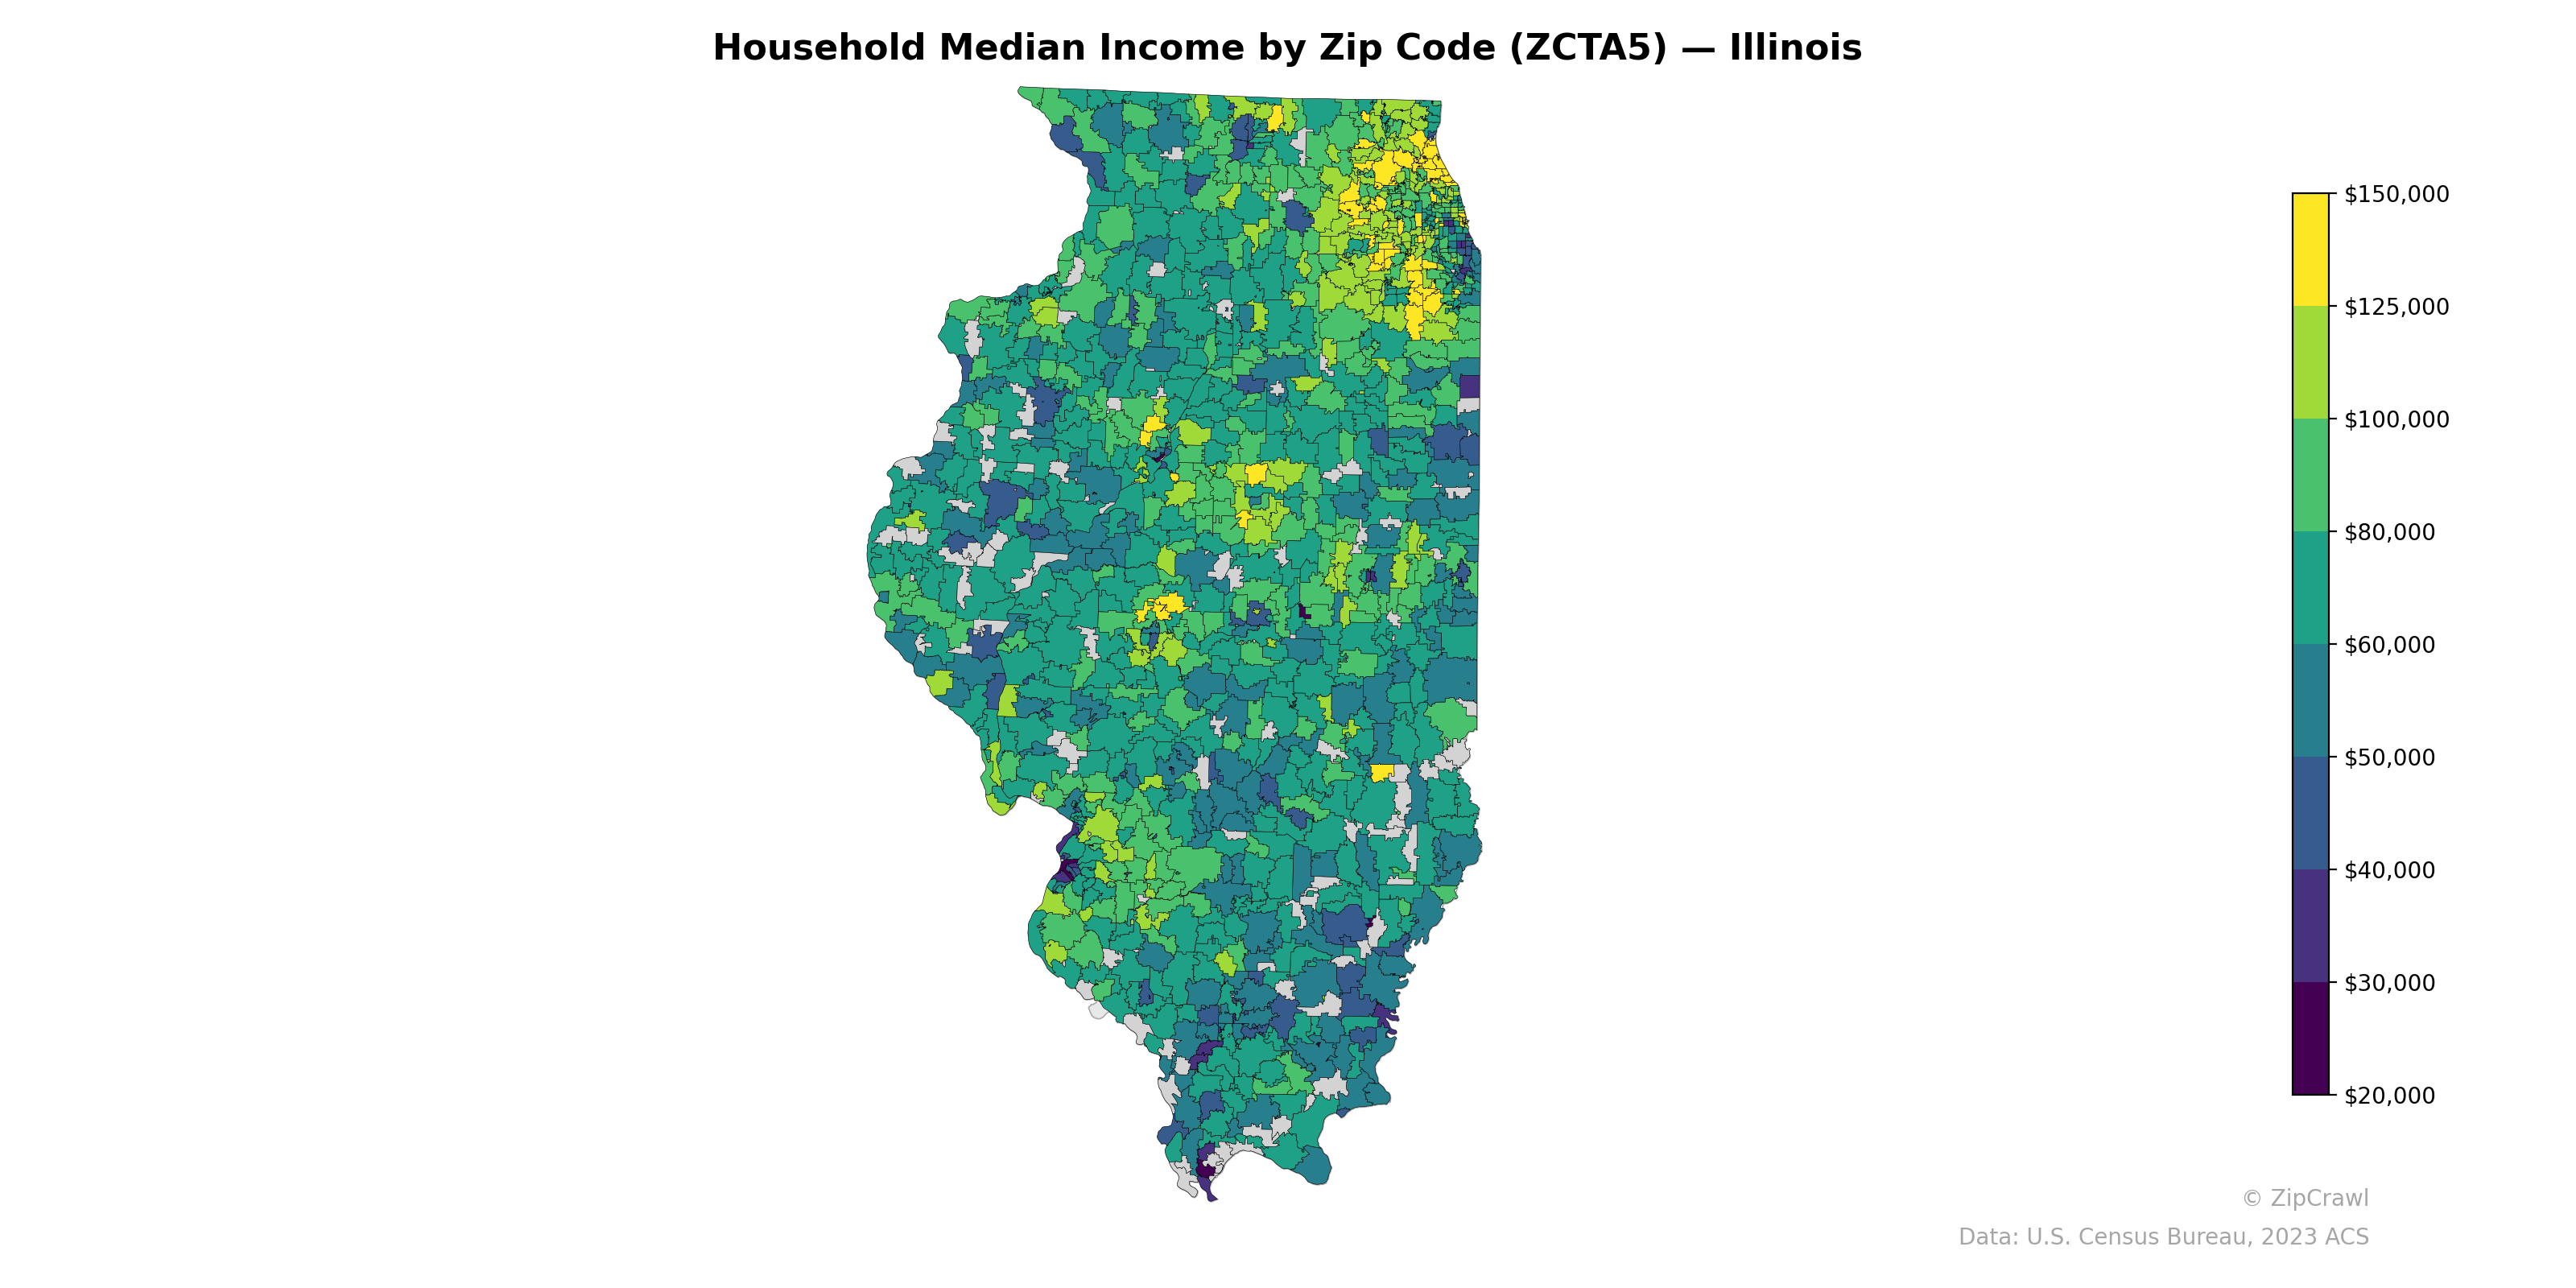
NOTE: Gray indicates insufficient data or a suppressed estimate.
The Chicago suburban collar counties—particularly the North Shore and western DuPage County—display the highest median household incomes in the state, with numerous zip codes exceeding $125,000, while zip codes within Chicago's South and West sides show stark contrasts, dipping below $30,000 in some areas. Central Illinois exhibits a patchwork pattern where zip codes anchored by mid-sized cities like Peoria, Springfield, and Champaign tend toward moderate incomes ($50,000–$70,000), surrounded by rural areas with generally lower earnings. Southern Illinois consistently registers among the lowest median incomes statewide, with concentrations of deep purple zip codes below $30,000 clustered in the Cairo region and along the southeastern border counties.
Data: U.S. Census Bureau, 2023 ACS
Explore
- % of Households with Broadband Internet, by Zip Code (ZCTA5) — Oregon
- Population Non-Hispanic Black % by Zip Code (ZCTA5) — Washington D.C.
- Housing Vacancy Rate by Zip Code (ZCTA5) — Wyoming
- Population Non-Hispanic White % by Zip Code (ZCTA5) — Washington D.C.
- Population Hispanic % by Zip Code (ZCTA5) — Washington D.C.
- % of Population on Food Stamps or SNAP (Last 12 Months), by Zip Code (ZCTA5) — Wyoming
- U.S. Citizens (% of Population Over 18) by Zip Code (ZCTA5) — Washington D.C.
- Married Couple (% of all Households) by Zip Code (ZCTA5) — Wyoming
- Median Age by Zip Code (ZCTA5) — Washington D.C.
- Population Non-Hispanic Asian % by Zip Code (ZCTA5) — Wyoming
- Married Couple (% of all Households) by County
- Population Hispanic % by Zip Code (ZCTA5) — Illinois
- Population Non-Hispanic Black % by Zip Code (ZCTA5) — Illinois
- Population Non-Hispanic White % by Zip Code (ZCTA5) — Illinois
- Population Non-Hispanic American Indian % by Zip Code (ZCTA5) — Illinois
- % of Population on Food Stamps or SNAP (Last 12 Months), by Zip Code (ZCTA5) — New York
- U.S. Citizens (% of Population Over 18) by Zip Code (ZCTA5) — Illinois
- Population Non-Hispanic Asian % by Zip Code (ZCTA5) — New York
- High School Graduate (% of Over 25) by Zip Code (ZCTA5) — Illinois
- Median Age by Zip Code (ZCTA5) — Illinois
- Population Non-Hispanic American Indian % by Zip Code (ZCTA5) — Vermont
- Bachelor's Degree or Higher (% of Over 25) by Zip Code (ZCTA5) — Vermont
- Housing Vacancy Rate by Zip Code (ZCTA5) — Vermont
- % of Households with Broadband Internet, by Zip Code (ZCTA5) — Nebraska
- % of Households with Broadband Internet, by Zip Code (ZCTA5) — Vermont
- % of Households with Broadband Internet, by Zip Code (ZCTA5) — Nevada
- High School Graduate (% of Over 25) by Zip Code (ZCTA5) — Vermont
- % of Households with Broadband Internet, by Zip Code (ZCTA5) — North Dakota
- % of Households with Broadband Internet, by Zip Code (ZCTA5) — Maine
- Married Couple (% of all Households) by Zip Code (ZCTA5) — Vermont
- Household Median Income by Zip Code (ZCTA5) — Iowa
- Household Median Income by Zip Code (ZCTA5) — Indiana
- Household Median Income by Zip Code (ZCTA5) — Utah
- Household Median Income by Zip Code (ZCTA5) — Idaho
- Household Median Income by Zip Code (ZCTA5) — Maine
- Household Median Income by Zip Code (ZCTA5) — Ohio
- Household Median Income by Zip Code (ZCTA5) — Texas
- Household Median Income by Zip Code (ZCTA5) — Hawaii
- Household Median Income by Zip Code (ZCTA5) — Michigan
- Household Median Income by Zip Code (ZCTA5) — Nevada