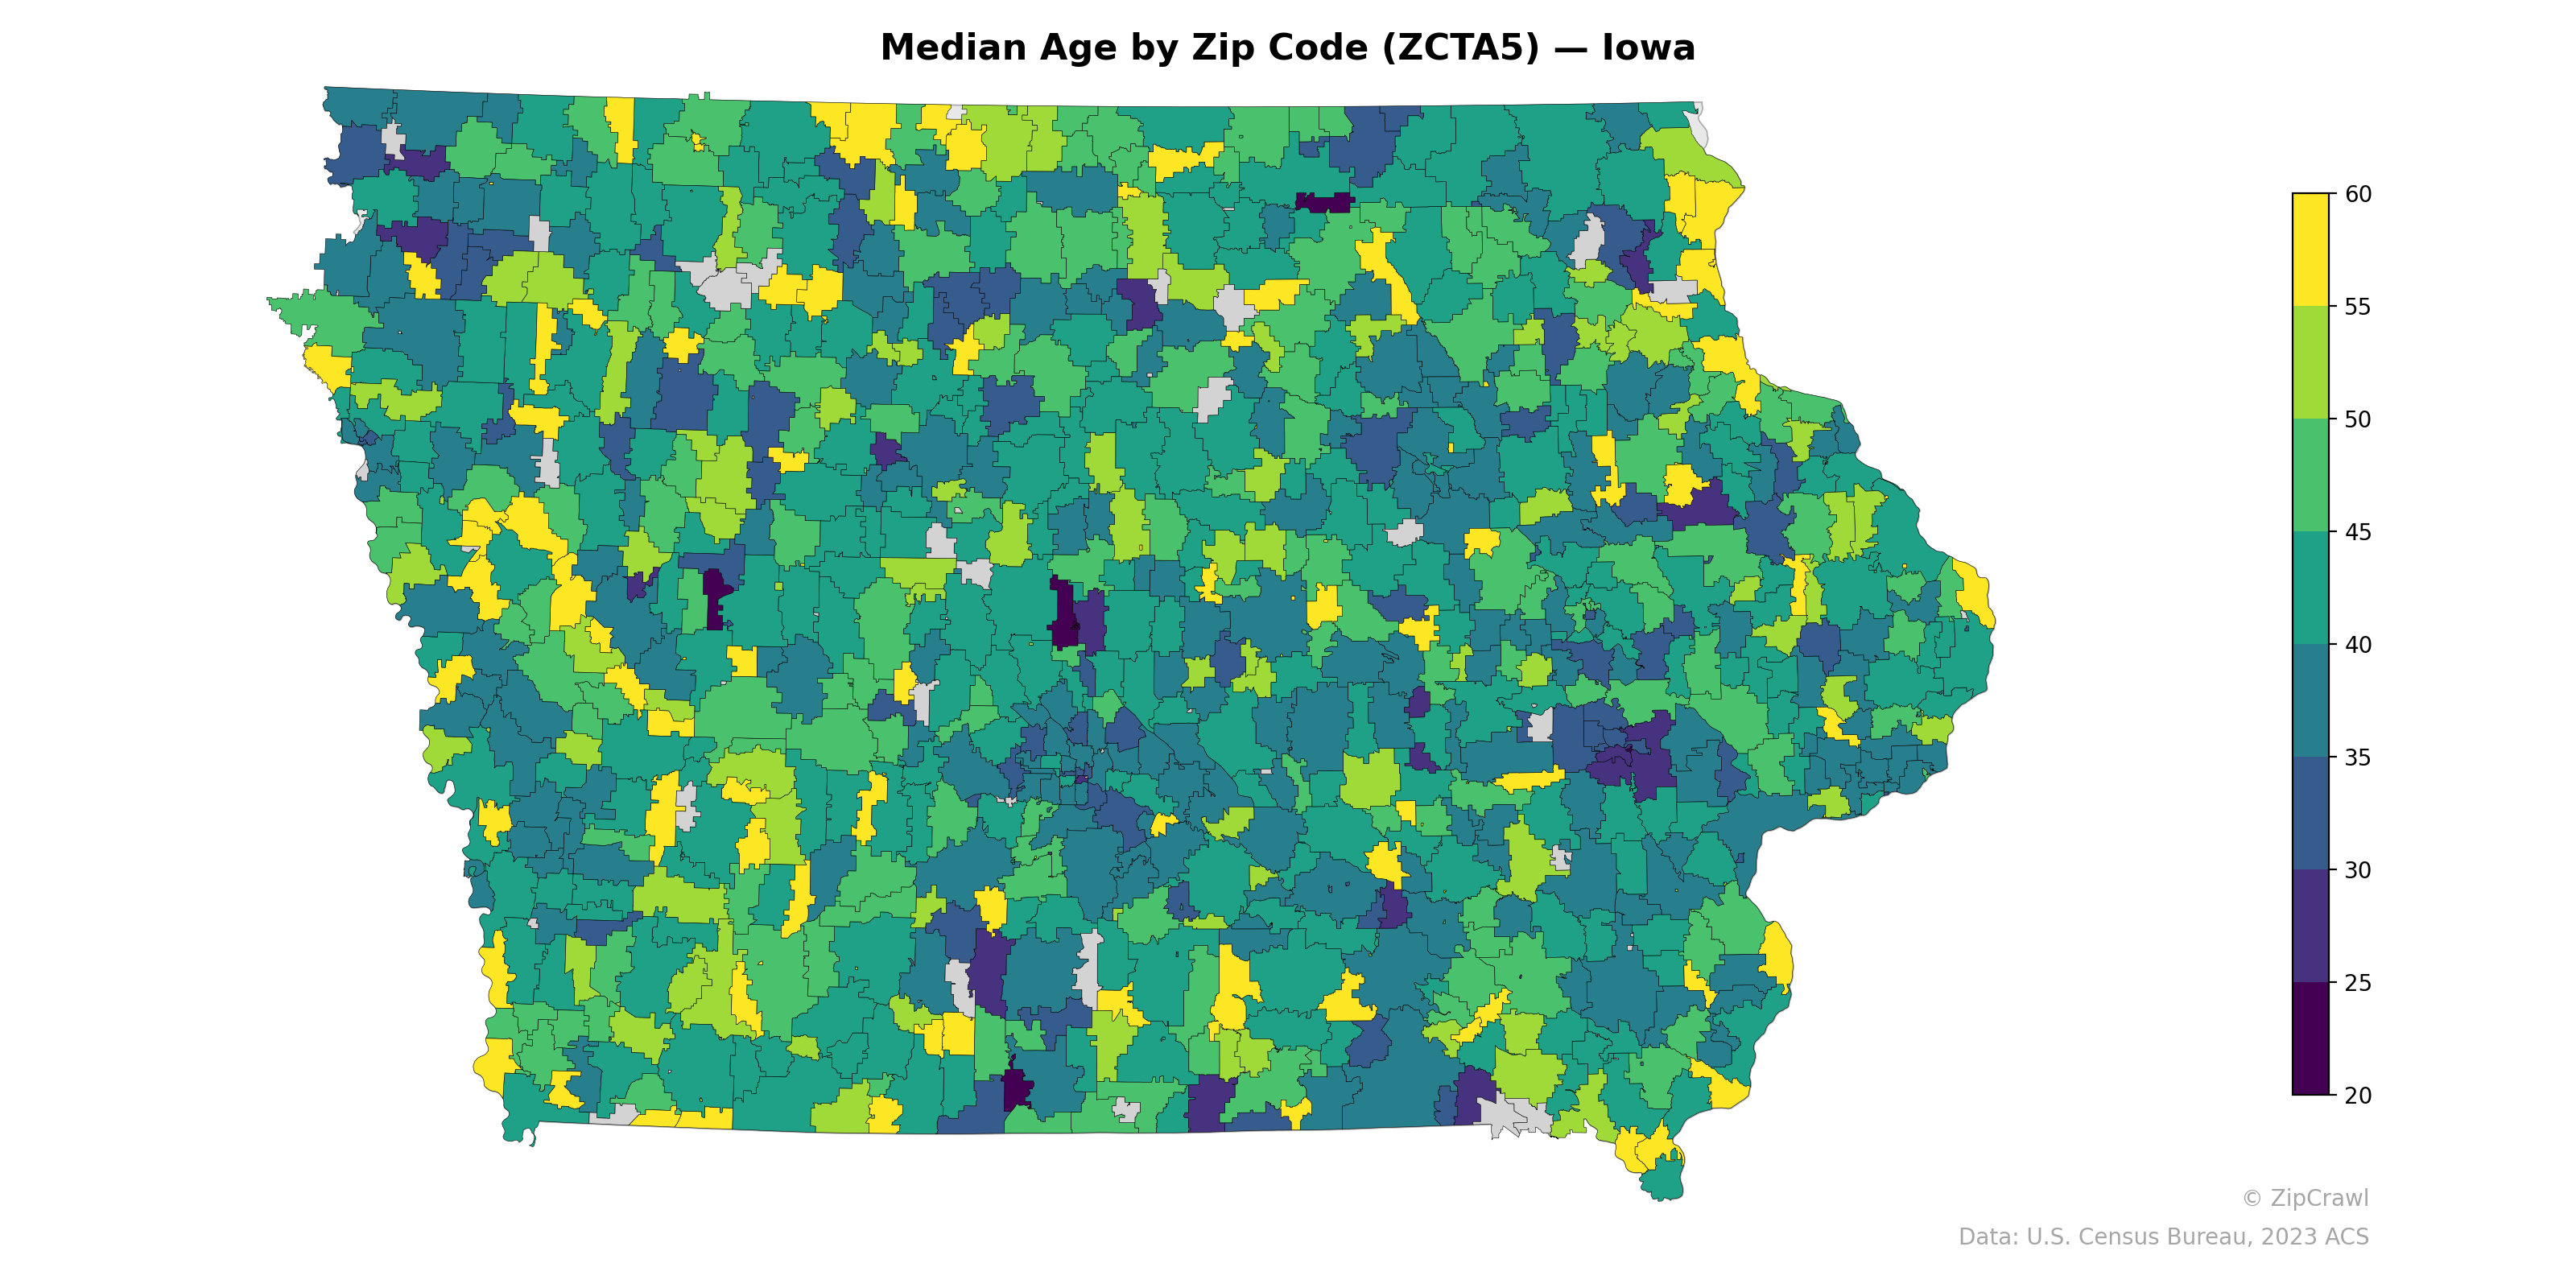
NOTE: Gray indicates insufficient data or a suppressed estimate.
Iowa's median age landscape reveals a pronounced pattern of younger populations concentrated in zip codes containing college towns and urban centers—notably the deep purple zones near Iowa City, Ames, and Cedar Falls, where median ages dip below 25—contrasted with the yellow-hued rural periphery along the western and southern borders where median ages frequently exceed 55. The northeastern corner of the state stands out as a particularly aging region, with a broad cluster of elevated median ages stretching along the Mississippi River bluffs. Much of central Iowa maintains a moderate median age in the 40–45 range, though scattered pockets of very low median ages likely correspond to smaller college communities or institutional populations embedded within otherwise older rural counties.
Data: U.S. Census Bureau, 2023 ACS
Explore
- Household Median Income by Zip Code (ZCTA5) — Florida
- Population Hispanic % by Zip Code (ZCTA5) — Iowa
- Population Non-Hispanic White % by Zip Code (ZCTA5) — Iowa
- % of Population on Food Stamps or SNAP (Last 12 Months), by Zip Code (ZCTA5) — Utah
- Household Median Income by Zip Code (ZCTA5) — Iowa
- Population Non-Hispanic Black % by Zip Code (ZCTA5) — Iowa
- Married Couple (% of all Households) by Zip Code (ZCTA5) — Utah
- U.S. Citizens (% of Population Over 18) by Zip Code (ZCTA5) — Iowa
- Housing Vacancy Rate by Zip Code (ZCTA5) — Utah
- Population Non-Hispanic Asian % by Zip Code (ZCTA5) — Utah
- Housing Owner-Occupied Median Value ($), by County
- Housing % of Units Built Since 2010, by Zip Code (ZCTA5) — Florida
- Population Non-Hispanic American Indian % by Zip Code (ZCTA5) — Florida
- High School Graduate (% of Over 25) by Zip Code (ZCTA5) — Florida
- Population Hispanic % by Zip Code (ZCTA5) — Florida
- Housing % of Units Built Since 2010, by Zip Code (ZCTA5) — Georgia
- U.S. Citizens (% of Population Over 18) by Zip Code (ZCTA5) — Florida
- Population Non-Hispanic Asian % by Zip Code (ZCTA5) — California
- % of Population on Food Stamps or SNAP (Last 12 Months), by Zip Code (ZCTA5) — California
- Population Non-Hispanic Black % by Zip Code (ZCTA5) — Florida
- Population Non-Hispanic White % by Zip Code (ZCTA5) — Florida
- Married Couple (% of all Households) by Zip Code (ZCTA5) — Connecticut
- High School Graduate (% of Over 25) by Zip Code (ZCTA5) — Connecticut
- Housing Vacancy Rate by Zip Code (ZCTA5) — Connecticut
- Housing % of Units Built Since 2010, by Zip Code (ZCTA5) — Connecticut
- Housing Median Monthly Rent ($), by Zip Code (ZCTA5) — Nevada
- Population Hispanic % by Zip Code (ZCTA5) — Mississippi
- Bachelor's Degree or Higher (% of Over 25) by Zip Code (ZCTA5) — Connecticut
- Population Non-Hispanic American Indian % by Zip Code (ZCTA5) — Connecticut
- Household Average Size by Zip Code (ZCTA5) — Connecticut
- Median Age by Zip Code (ZCTA5) — Indiana
- Median Age by Zip Code (ZCTA5) — Idaho
- Median Age by Zip Code (ZCTA5) — Ohio
- Median Age by Zip Code (ZCTA5) — Maine
- Median Age by Zip Code (ZCTA5) — Utah
- Median Age by Zip Code (ZCTA5) — Texas
- Median Age by Zip Code (ZCTA5) — Alaska
- Median Age by Zip Code (ZCTA5) — Illinois
- Median Age by Zip Code (ZCTA5) — Colorado
- Median Age by Zip Code (ZCTA5) — Arizona