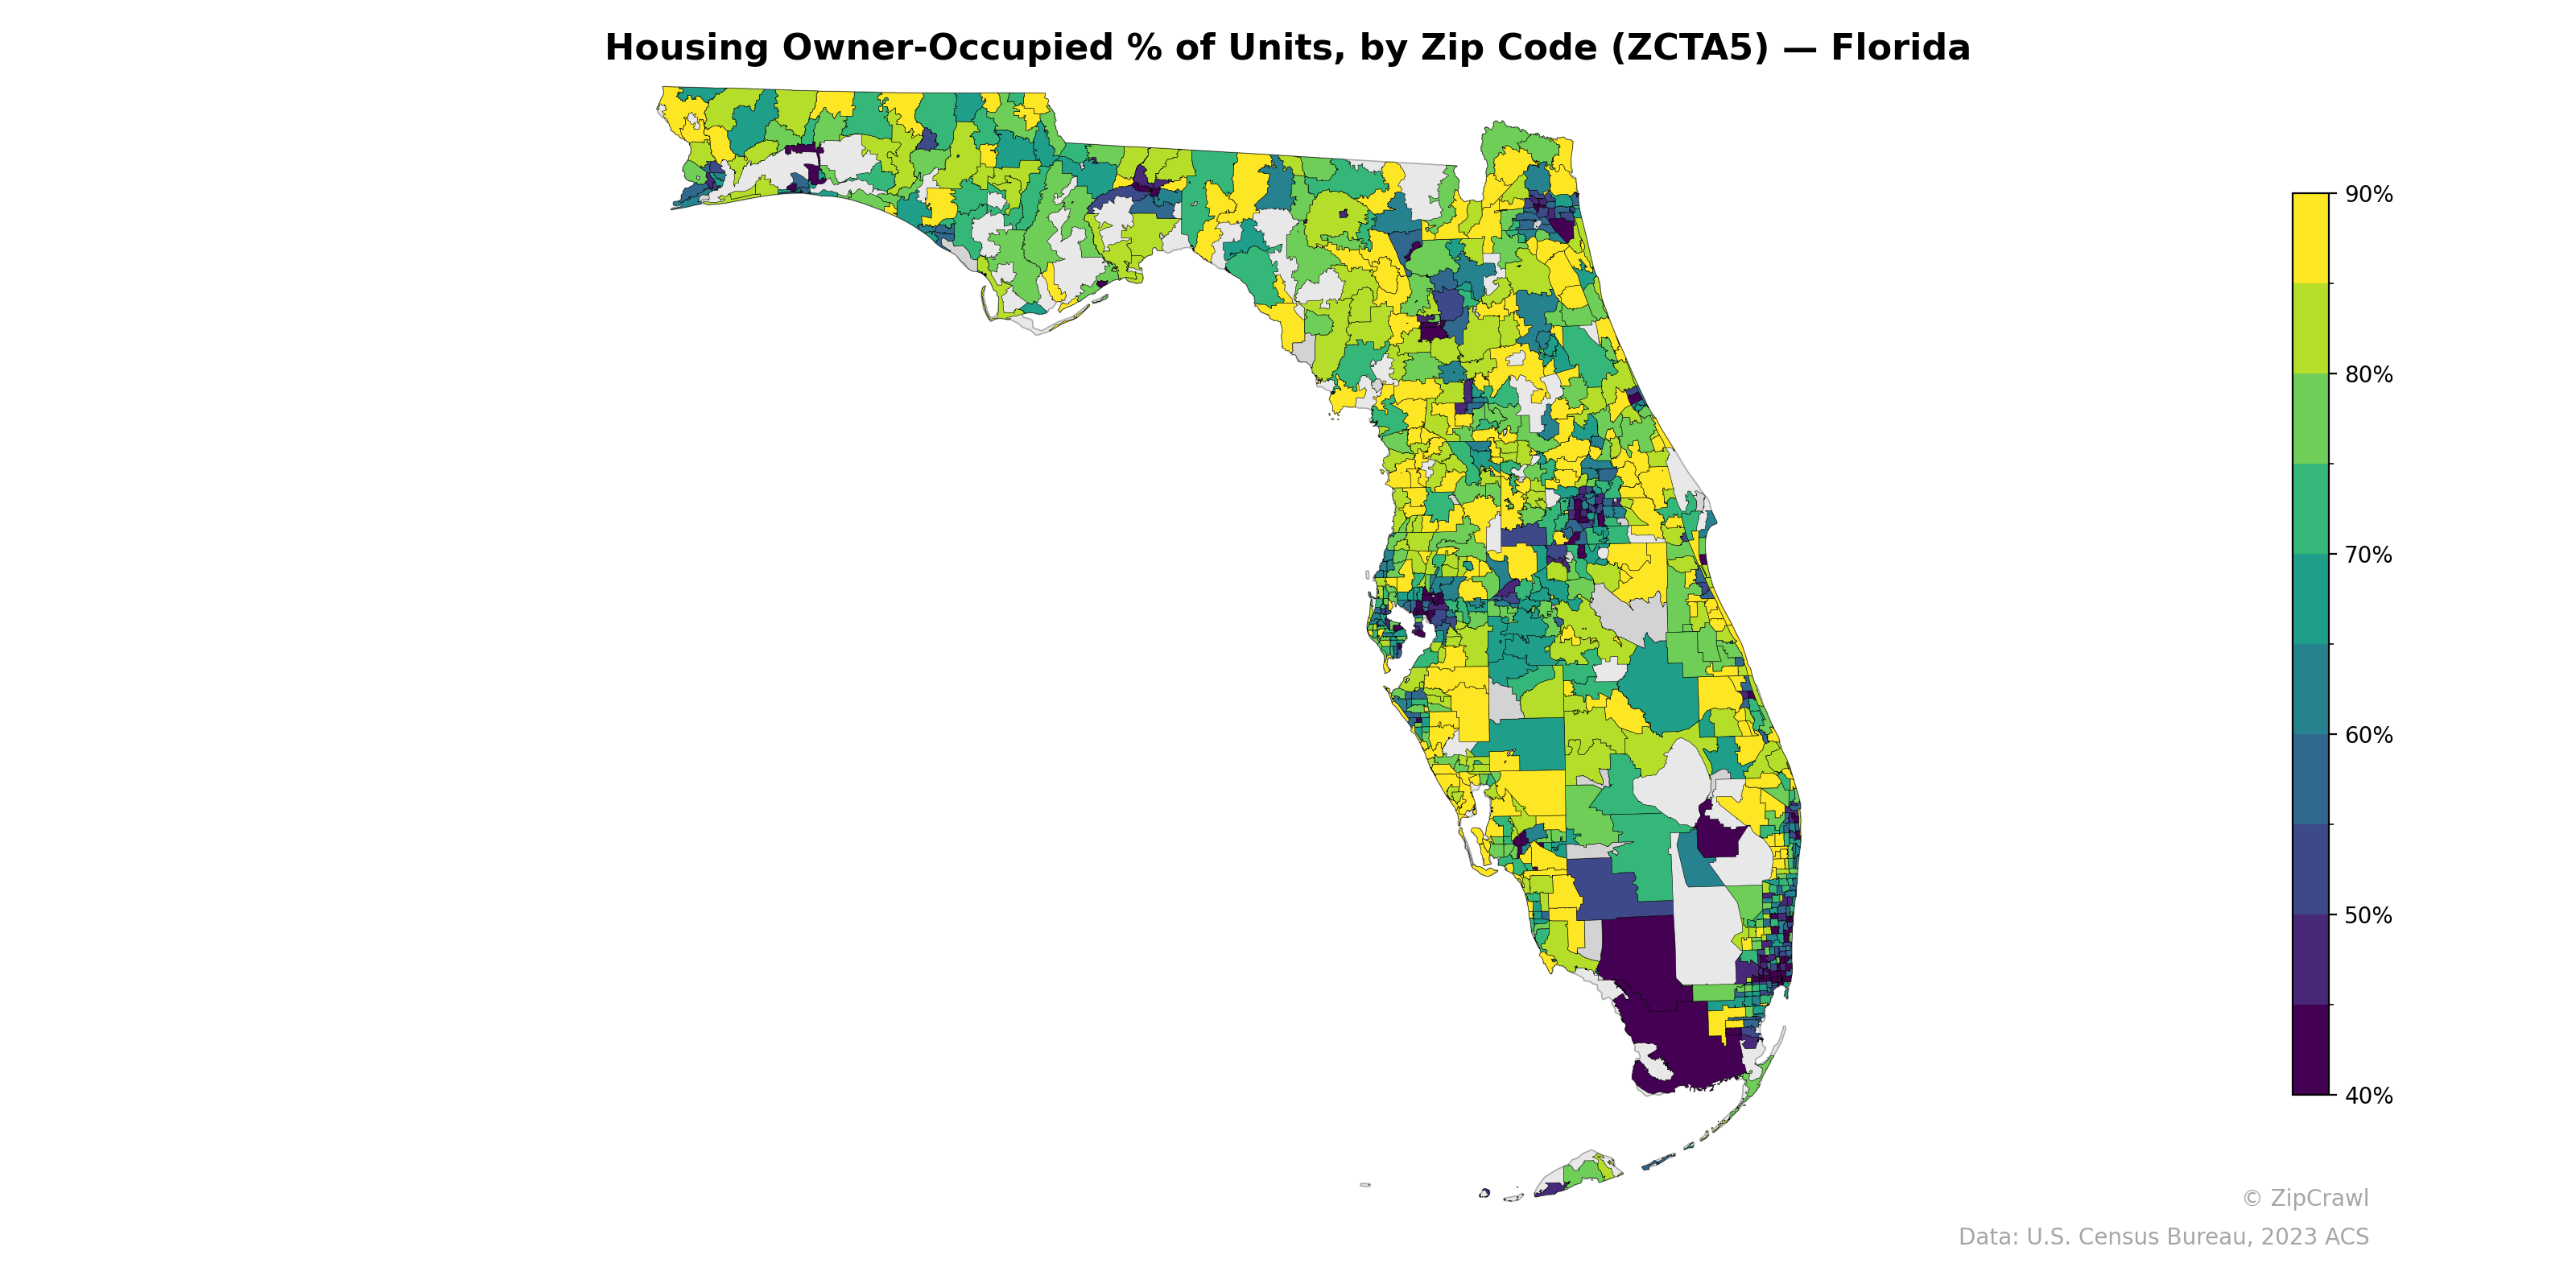
NOTE: Gray indicates insufficient data or a suppressed estimate.
South Florida's Miami-Dade County stands out with consistently low owner-occupancy rates below 50%, forming the darkest cluster on the map, reflecting the region's heavy concentration of rental housing and condominium markets. Rural and suburban zip codes across the Panhandle, Nature Coast, and interior central Florida generally display the highest owner-occupancy rates at 80–90%, characteristic of less transient, single-family-home-dominated communities. A notable patchwork pattern emerges along the I-4 corridor between Tampa and Orlando, where adjacent zip codes alternate sharply between high and low owner-occupancy, likely reflecting the juxtaposition of established suburban neighborhoods with dense rental-heavy urban cores and tourist-oriented areas.
Data: U.S. Census Bureau, 2023 ACS
Explore
- % of Population on Food Stamps or SNAP (Last 12 Months), by Zip Code (ZCTA5) — Kansas
- U.S. Citizens (% of Population Over 18) by Zip Code (ZCTA5) — New Mexico
- Median Age by Zip Code (ZCTA5) — New Mexico
- Married Couple (% of all Households) by Zip Code (ZCTA5) — Kansas
- Population Non-Hispanic Black % by Zip Code (ZCTA5) — New Mexico
- Population Non-Hispanic White % by Zip Code (ZCTA5) — New Mexico
- Housing Vacancy Rate by Zip Code (ZCTA5) — Kansas
- Household Median Income by Zip Code (ZCTA5) — New Mexico
- Population Non-Hispanic Asian % by Zip Code (ZCTA5) — Kansas
- Population Hispanic % by Zip Code (ZCTA5) — New Mexico
- Housing Median Monthly Rent ($), by County
- Housing Median Monthly Rent ($), by Zip Code (ZCTA5) — Florida
- Housing Vacancy Rate by Zip Code (ZCTA5) — Florida
- Housing % of Units Built Since 2010, by Zip Code (ZCTA5) — Florida
- Housing Owner-Occupied Median Value ($), by Zip Code (ZCTA5) — Florida
- Household Average Size by Zip Code (ZCTA5) — Florida
- Bachelor's Degree or Higher (% of Over 25) by Zip Code (ZCTA5) — Florida
- % of Households with Broadband Internet, by Zip Code (ZCTA5) — Florida
- Married Couple (% of all Households) by Zip Code (ZCTA5) — Florida
- % of Population without Health Insurance, by Zip Code (ZCTA5) — Florida
- % of Population on Food Stamps or SNAP (Last 12 Months), by Zip Code (ZCTA5) — Mississippi
- % of Population without Health Insurance, by Zip Code (ZCTA5) — Mississippi
- U.S. Citizens (% of Population Over 18) by Zip Code (ZCTA5) — Kansas
- % of Population on Food Stamps or SNAP (Last 12 Months), by Zip Code (ZCTA5) — Louisiana
- Median Age by Zip Code (ZCTA5) — Idaho
- % of Population on Food Stamps or SNAP (Last 12 Months), by Zip Code (ZCTA5) — Utah
- Bachelor's Degree or Higher (% of Over 25) by Zip Code (ZCTA5) — Mississippi
- High School Graduate (% of Over 25) by Zip Code (ZCTA5) — Mississippi
- % of Households with Broadband Internet, by Zip Code (ZCTA5) — Mississippi
- Population Non-Hispanic American Indian % by Zip Code (ZCTA5) — Mississippi
- Housing Owner-Occupied % of Units, by Zip Code (ZCTA5) — Idaho
- Housing Owner-Occupied % of Units, by Zip Code (ZCTA5) — Utah
- Housing Owner-Occupied % of Units, by Zip Code (ZCTA5) — Ohio
- Housing Owner-Occupied % of Units, by Zip Code (ZCTA5) — Colorado
- Housing Owner-Occupied % of Units, by Zip Code (ZCTA5) — Nevada
- Housing Owner-Occupied % of Units, by Zip Code (ZCTA5) — Iowa
- Housing Owner-Occupied % of Units, by Zip Code (ZCTA5) — Texas
- Housing Owner-Occupied % of Units, by Zip Code (ZCTA5) — Hawaii
- Housing Owner-Occupied % of Units, by Zip Code (ZCTA5) — Oregon
- Housing Owner-Occupied % of Units, by Zip Code (ZCTA5) — Maine