NOTE: Gray indicates insufficient data or a suppressed estimate.
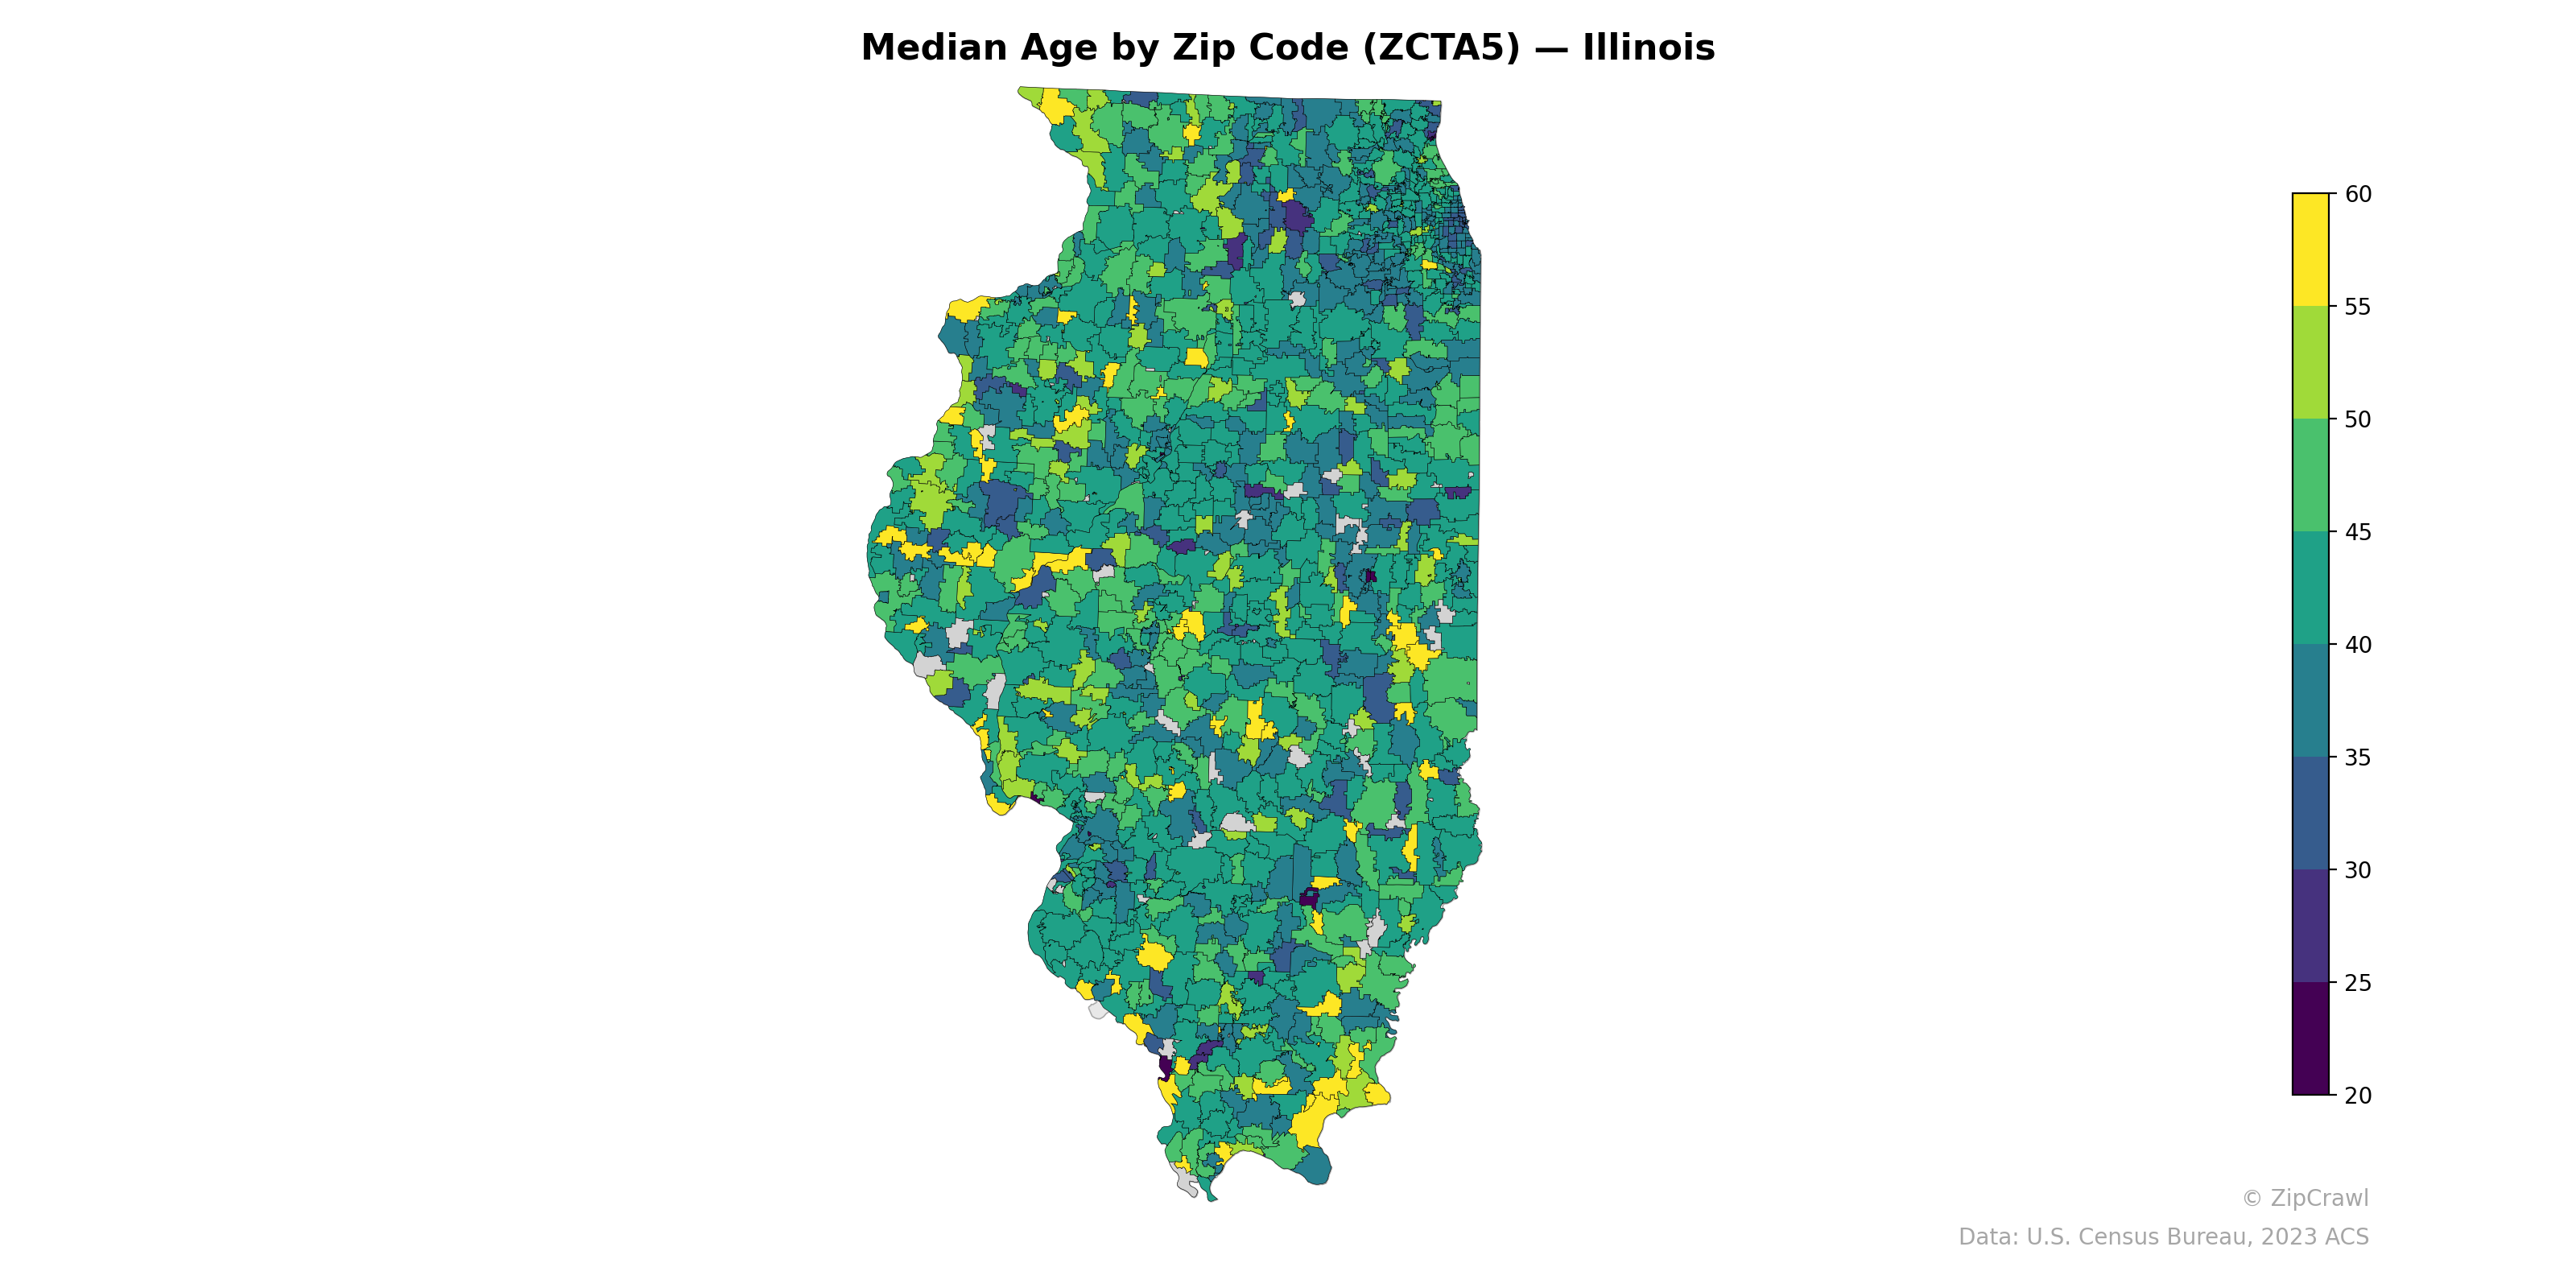
The Chicago metropolitan area in northeastern Illinois displays significant internal variation, with pockets of very low median ages (under 30) in dense urban zip codes contrasting sharply against affluent suburban communities trending into the mid-40s to 50s. Rural zip codes across central and western Illinois generally skew older, with numerous scattered yellow-shaded areas indicating median ages above 55, likely reflecting small agricultural communities experiencing youth outmigration. The southern tip of the state near Cairo stands out with notably dark shading suggesting some of the youngest median ages in the state, potentially driven by institutional populations or distinct demographic compositions.
Data: U.S. Census Bureau, 2023 ACS
Explore
- Population Non-Hispanic American Indian % by Zip Code (ZCTA5) — Washington D.C.
- Housing Median Monthly Rent ($), by Zip Code (ZCTA5) — Washington D.C.
- Housing Owner-Occupied % of Units, by Zip Code (ZCTA5) — Washington D.C.
- % of Households with Broadband Internet, by Zip Code (ZCTA5) — Washington D.C.
- Housing % of Units Built Since 2010, by Zip Code (ZCTA5) — Washington D.C.
- % of Population without Health Insurance, by Zip Code (ZCTA5) — Oregon
- Housing Owner-Occupied Median Value ($), by Zip Code (ZCTA5) — Washington D.C.
- % of Population without Health Insurance, by Zip Code (ZCTA5) — Washington D.C.
- High School Graduate (% of Over 25) by Zip Code (ZCTA5) — Washington D.C.
- Bachelor's Degree or Higher (% of Over 25) by Zip Code (ZCTA5) — Washington D.C.
- Household Average Size by Zip Code (ZCTA5) — Washington D.C.
- Married Couple (% of all Households) by County
- High School Graduate (% of Over 25) by Zip Code (ZCTA5) — Illinois
- Population Non-Hispanic White % by Zip Code (ZCTA5) — Illinois
- Population Hispanic % by Zip Code (ZCTA5) — Illinois
- Household Median Income by Zip Code (ZCTA5) — Illinois
- Population Non-Hispanic Black % by Zip Code (ZCTA5) — Illinois
- Population Non-Hispanic Asian % by Zip Code (ZCTA5) — New York
- % of Population on Food Stamps or SNAP (Last 12 Months), by Zip Code (ZCTA5) — New York
- U.S. Citizens (% of Population Over 18) by Zip Code (ZCTA5) — Illinois
- Population Non-Hispanic American Indian % by Zip Code (ZCTA5) — Illinois
- Population Non-Hispanic American Indian % by Zip Code (ZCTA5) — Vermont
- % of Population without Health Insurance, by Zip Code (ZCTA5) — North Dakota
- Married Couple (% of all Households) by Zip Code (ZCTA5) — Vermont
- Population Hispanic % by Zip Code (ZCTA5) — Washington D.C.
- % of Population without Health Insurance, by Zip Code (ZCTA5) — Nevada
- Bachelor's Degree or Higher (% of Over 25) by Zip Code (ZCTA5) — Vermont
- % of Population without Health Insurance, by Zip Code (ZCTA5) — Maine
- High School Graduate (% of Over 25) by Zip Code (ZCTA5) — Vermont
- % of Population without Health Insurance, by Zip Code (ZCTA5) — Nebraska
- Median Age by Zip Code (ZCTA5) — Iowa
- Median Age by Zip Code (ZCTA5) — Idaho
- Median Age by Zip Code (ZCTA5) — Indiana
- Median Age by Zip Code (ZCTA5) — Ohio
- Median Age by Zip Code (ZCTA5) — Utah
- Median Age by Zip Code (ZCTA5) — Maine
- Median Age by Zip Code (ZCTA5) — Alaska
- Median Age by Zip Code (ZCTA5) — Texas
- Median Age by Zip Code (ZCTA5) — Colorado
- Median Age by Zip Code (ZCTA5) — Arizona