NOTE: Gray indicates insufficient data or a suppressed estimate.
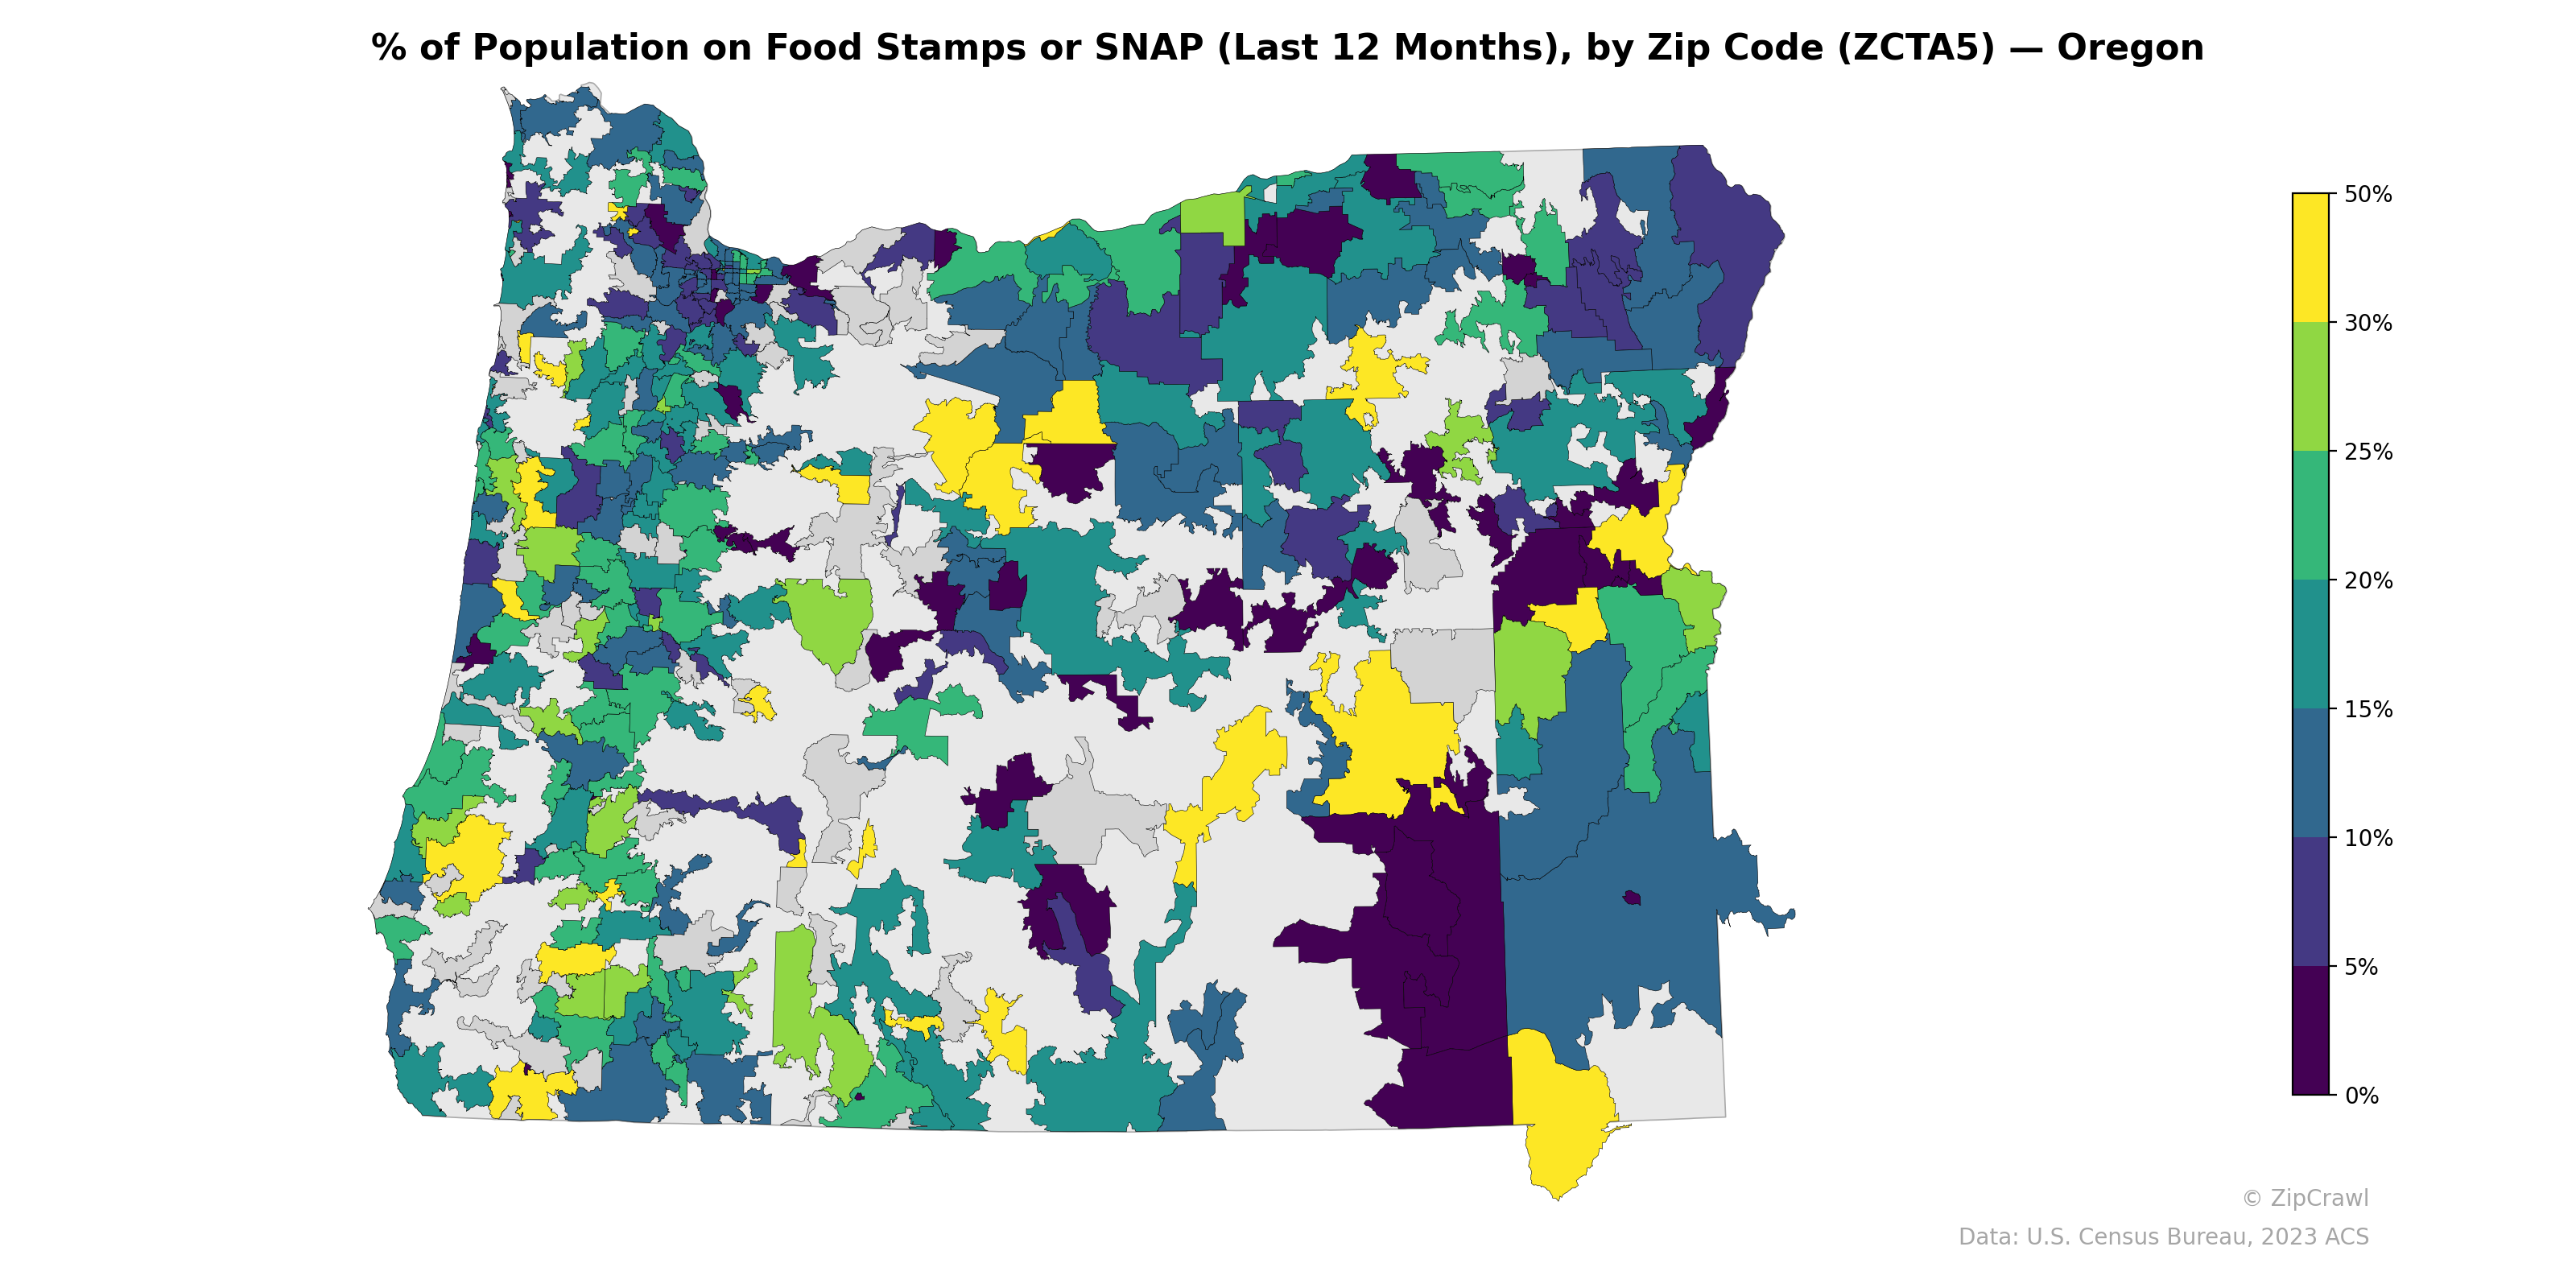
SNAP participation rates across Oregon exhibit substantial spatial variation, with several rural zip codes in southern, central, and eastern Oregon displaying rates exceeding 30–50%, likely reflecting lower incomes and limited employment opportunities in those areas. The Portland metropolitan area and Willamette Valley corridor show a mixed pattern, with many suburban zip codes reporting relatively low SNAP usage (under 10%) alongside pockets of higher participation in urban core and smaller valley towns. Notable clusters of elevated food stamp reliance also appear along the southern coast and in parts of northeastern Oregon, contrasting sharply with affluent suburban zip codes west and south of Portland that register among the state's lowest rates.
Data: U.S. Census Bureau, 2023 ACS
Explore
- Household Average Size by Zip Code (ZCTA5) — California
- Housing Owner-Occupied % of Units, by Zip Code (ZCTA5) — Illinois
- Housing Vacancy Rate by Zip Code (ZCTA5) — Oregon
- Population Hispanic % by Zip Code (ZCTA5) — Oklahoma
- Population Non-Hispanic White % by Zip Code (ZCTA5) — Oklahoma
- Married Couple (% of all Households) by Zip Code (ZCTA5) — Oregon
- U.S. Citizens (% of Population Over 18) by Zip Code (ZCTA5) — Oklahoma
- Household Median Income by Zip Code (ZCTA5) — Oklahoma
- Population Non-Hispanic Black % by Zip Code (ZCTA5) — Oklahoma
- Median Age by Zip Code (ZCTA5) — Oklahoma
- Population Non-Hispanic Asian % by Zip Code (ZCTA5) — Oregon
- Housing Owner-Occupied % of Units, by County
- Housing Median Monthly Rent ($), by Zip Code (ZCTA5) — California
- Housing Owner-Occupied Median Value ($), by Zip Code (ZCTA5) — California
- Housing % of Units Built Since 2010, by Zip Code (ZCTA5) — California
- % of Population without Health Insurance, by Zip Code (ZCTA5) — California
- Housing Owner-Occupied % of Units, by Zip Code (ZCTA5) — California
- Bachelor's Degree or Higher (% of Over 25) by Zip Code (ZCTA5) — California
- % of Households with Broadband Internet, by Zip Code (ZCTA5) — California
- Housing Vacancy Rate by Zip Code (ZCTA5) — California
- Married Couple (% of all Households) by Zip Code (ZCTA5) — California
- Housing Median Monthly Rent ($), by Zip Code (ZCTA5) — Oregon
- Housing % of Units Built Since 2010, by Zip Code (ZCTA5) — Oregon
- Population Non-Hispanic Black % by Zip Code (ZCTA5) — Oregon
- Population Non-Hispanic White % by Zip Code (ZCTA5) — Oregon
- Housing Owner-Occupied % of Units, by Zip Code (ZCTA5) — Oregon
- Population Hispanic % by Zip Code (ZCTA5) — Oregon
- Housing Owner-Occupied Median Value ($), by Zip Code (ZCTA5) — Oregon
- Household Average Size by Zip Code (ZCTA5) — Oregon
- U.S. Citizens (% of Population Over 18) by Zip Code (ZCTA5) — Oregon
- % of Population on Food Stamps or SNAP (Last 12 Months), by Zip Code (ZCTA5) — Ohio
- % of Population on Food Stamps or SNAP (Last 12 Months), by Zip Code (ZCTA5) — Montana
- % of Population on Food Stamps or SNAP (Last 12 Months), by Zip Code (ZCTA5) — Maine
- % of Population on Food Stamps or SNAP (Last 12 Months), by Zip Code (ZCTA5) — Iowa
- % of Population on Food Stamps or SNAP (Last 12 Months), by Zip Code (ZCTA5) — Utah
- % of Population on Food Stamps or SNAP (Last 12 Months), by Zip Code (ZCTA5) — Idaho
- % of Population on Food Stamps or SNAP (Last 12 Months), by Zip Code (ZCTA5) — Vermont
- % of Population on Food Stamps or SNAP (Last 12 Months), by Zip Code (ZCTA5) — Texas
- % of Population on Food Stamps or SNAP (Last 12 Months), by Zip Code (ZCTA5) — Alaska
- % of Population on Food Stamps or SNAP (Last 12 Months), by Zip Code (ZCTA5) — Kansas