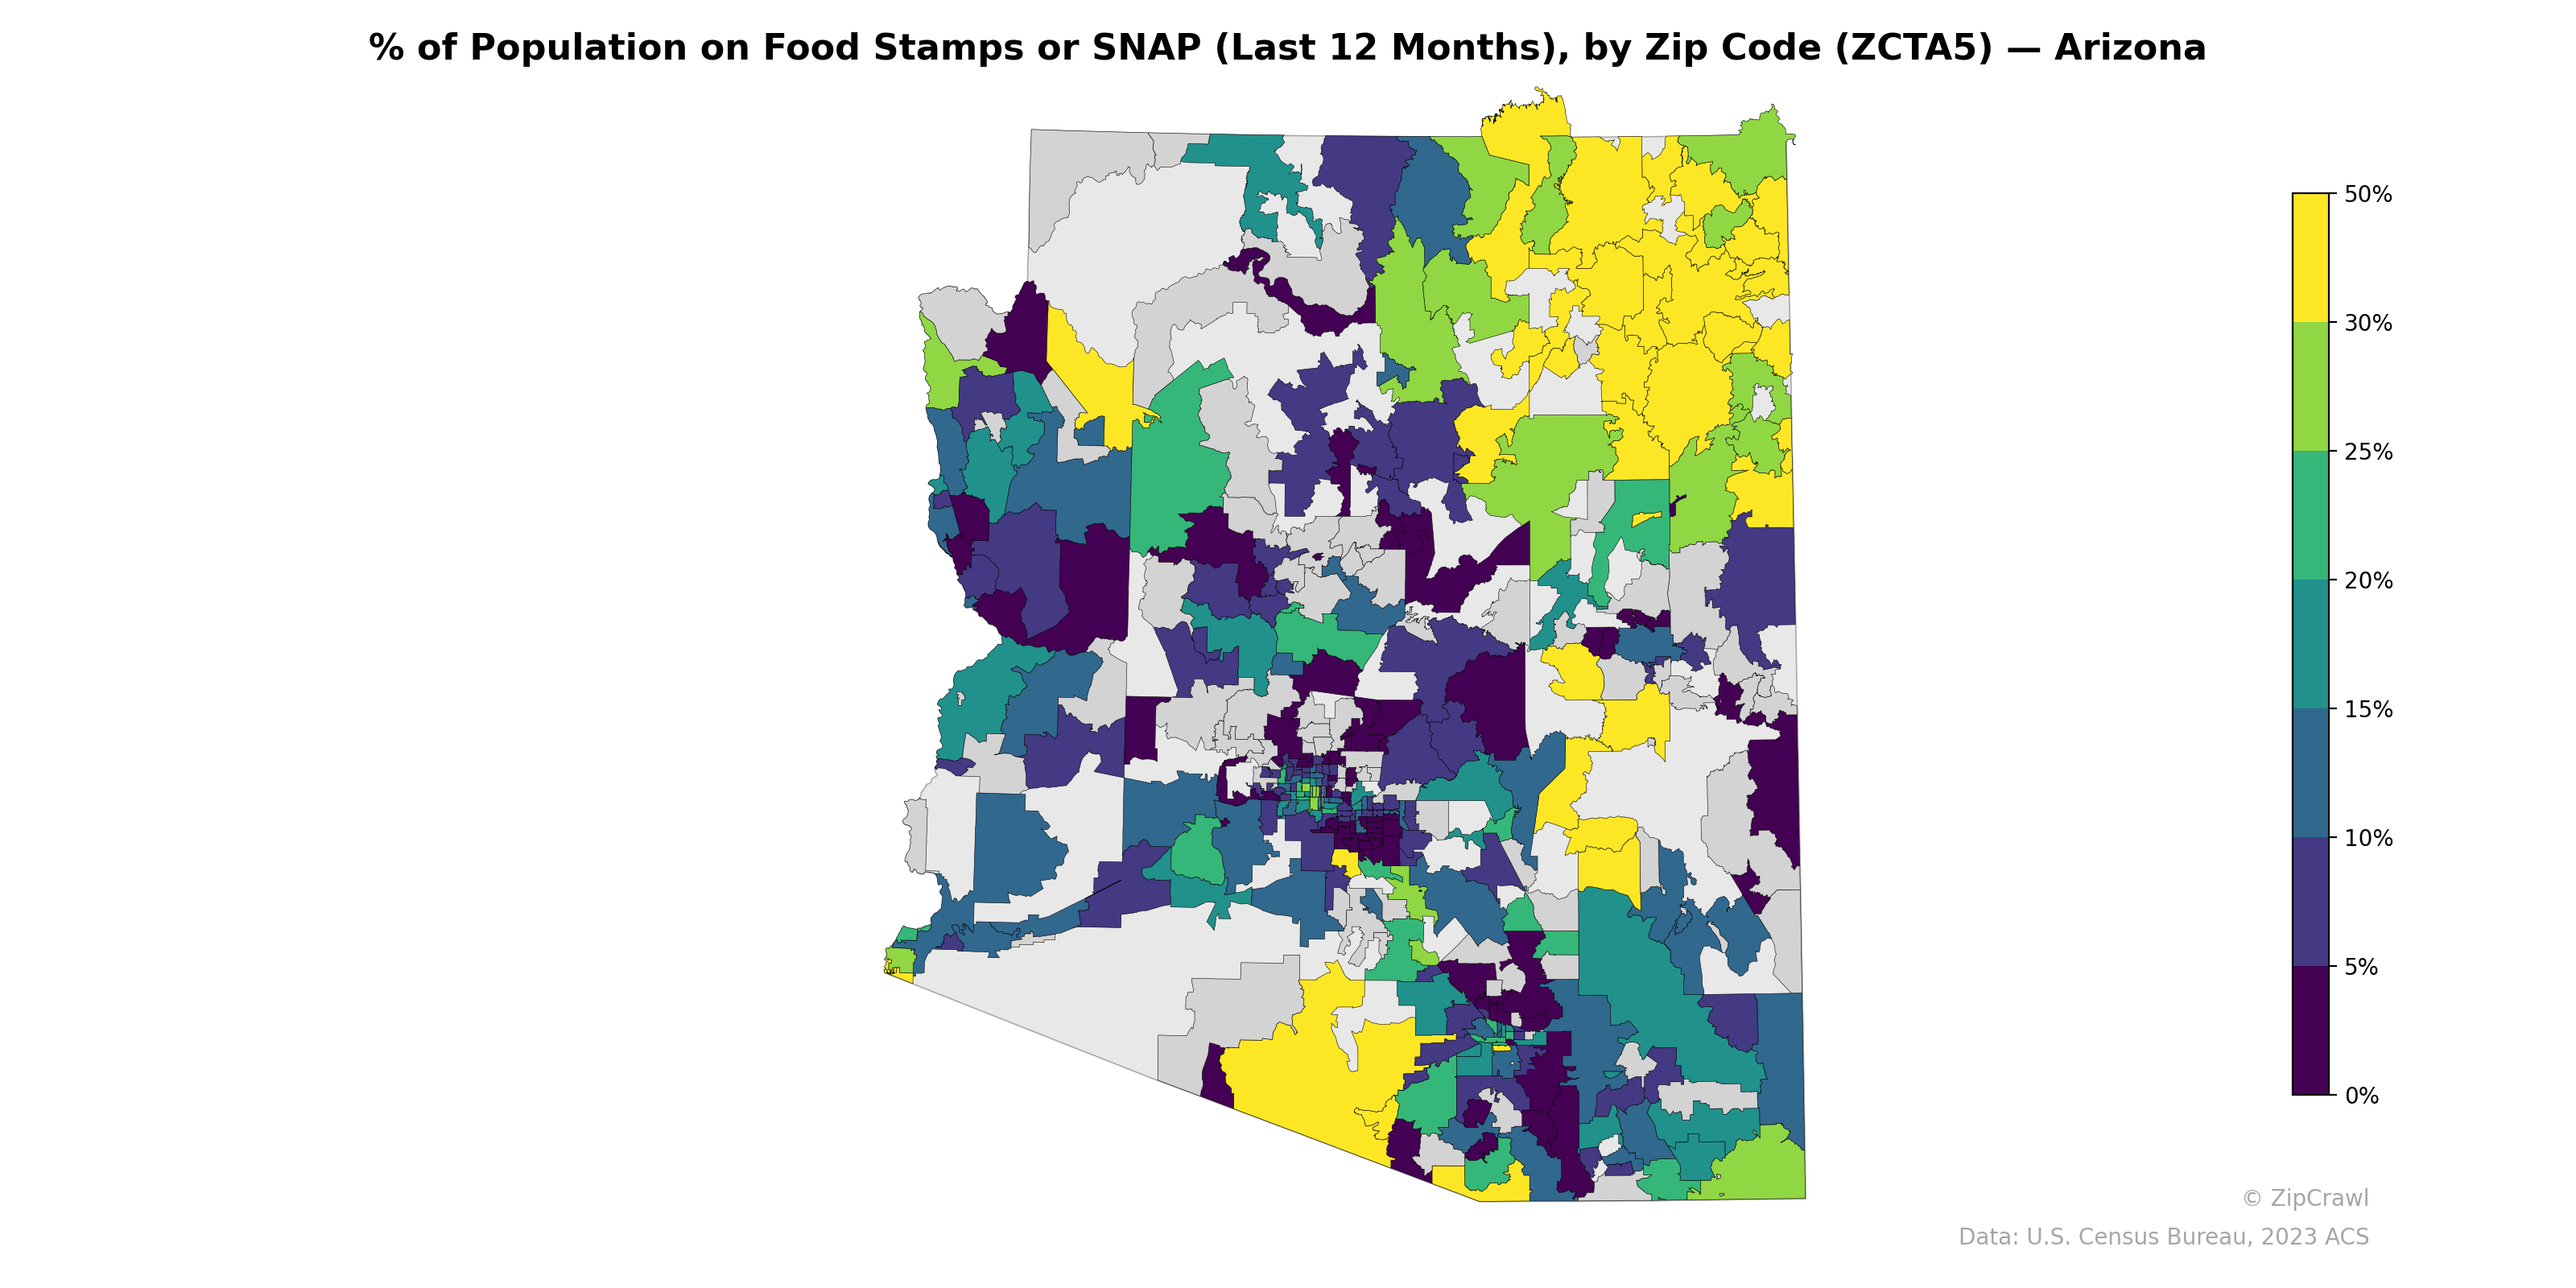
NOTE: Gray indicates insufficient data or a suppressed estimate.
The northeastern corner of Arizona, encompassing parts of the Navajo Nation and Apache County, exhibits the highest SNAP participation rates in the state, with multiple zip codes exceeding 35–50%, reflecting persistent poverty conditions on tribal lands. In contrast, the Phoenix metropolitan area displays sharp intra-urban variation, where affluent suburban zip codes in Scottsdale and the East Valley register near 0–5% while adjacent central Phoenix and south Phoenix zip codes reach 15–25%. Western and southwestern Arizona, including areas around Yuma and the border region, shows a mixed pattern with moderate-to-high SNAP usage interspersed with lower-participation zones, likely reflecting the uneven distribution of agricultural employment and military installations.
Data: U.S. Census Bureau, 2023 ACS
Explore
- Bachelor's Degree or Higher (% of Over 25) by Zip Code (ZCTA5) — Los Angeles Metro
- Population Non-Hispanic Black % by Zip Code (ZCTA5) — Tennessee
- Population Non-Hispanic White % by Zip Code (ZCTA5) — Tennessee
- Household Median Income by Zip Code (ZCTA5) — Tennessee
- Population Non-Hispanic American Indian % by Zip Code (ZCTA5) — Tennessee
- Median Age by Zip Code (ZCTA5) — Tennessee
- High School Graduate (% of Over 25) by Zip Code (ZCTA5) — Tennessee
- U.S. Citizens (% of Population Over 18) by Zip Code (ZCTA5) — Tennessee
- Population Non-Hispanic Asian % by Zip Code (ZCTA5) — Arizona
- Population Hispanic % by Zip Code (ZCTA5) — Tennessee
- High School Graduate (% of Over 25) by Zip Code (ZCTA5) — Rhode Island
- Population Non-Hispanic Black % by County
- Housing Vacancy Rate by Zip Code (ZCTA5) — Los Angeles Metro
- Married Couple (% of all Households) by Zip Code (ZCTA5) — Los Angeles Metro
- Housing % of Units Built Since 2010, by Zip Code (ZCTA5) — Los Angeles Metro
- Household Average Size by Zip Code (ZCTA5) — Los Angeles Metro
- Housing Owner-Occupied % of Units, by Zip Code (ZCTA5) — Los Angeles Metro
- % of Population without Health Insurance, by Zip Code (ZCTA5) — Los Angeles Metro
- Housing Owner-Occupied Median Value ($), by Zip Code (ZCTA5) — Los Angeles Metro
- % of Households with Broadband Internet, by Zip Code (ZCTA5) — Los Angeles Metro
- Housing Median Monthly Rent ($), by Zip Code (ZCTA5) — Los Angeles Metro
- Housing Median Monthly Rent ($), by Zip Code (ZCTA5) — Tennessee
- Housing Owner-Occupied % of Units, by Zip Code (ZCTA5) — Tennessee
- Housing % of Units Built Since 2010, by Zip Code (ZCTA5) — Tennessee
- Bachelor's Degree or Higher (% of Over 25) by Zip Code (ZCTA5) — Tennessee
- Household Average Size by Zip Code (ZCTA5) — Tennessee
- % of Households with Broadband Internet, by Zip Code (ZCTA5) — Tennessee
- % of Population without Health Insurance, by Zip Code (ZCTA5) — Tennessee
- Housing Owner-Occupied Median Value ($), by Zip Code (ZCTA5) — Tennessee
- Married Couple (% of all Households) by Zip Code (ZCTA5) — Tennessee
- % of Population on Food Stamps or SNAP (Last 12 Months), by Zip Code (ZCTA5) — Montana
- % of Population on Food Stamps or SNAP (Last 12 Months), by Zip Code (ZCTA5) — Alaska
- % of Population on Food Stamps or SNAP (Last 12 Months), by Zip Code (ZCTA5) — Ohio
- % of Population on Food Stamps or SNAP (Last 12 Months), by Zip Code (ZCTA5) — Oregon
- % of Population on Food Stamps or SNAP (Last 12 Months), by Zip Code (ZCTA5) — Arkansas
- % of Population on Food Stamps or SNAP (Last 12 Months), by Zip Code (ZCTA5) — Utah
- % of Population on Food Stamps or SNAP (Last 12 Months), by Zip Code (ZCTA5) — Iowa
- % of Population on Food Stamps or SNAP (Last 12 Months), by Zip Code (ZCTA5) — Maine
- % of Population on Food Stamps or SNAP (Last 12 Months), by Zip Code (ZCTA5) — Alabama
- % of Population on Food Stamps or SNAP (Last 12 Months), by Zip Code (ZCTA5) — Indiana