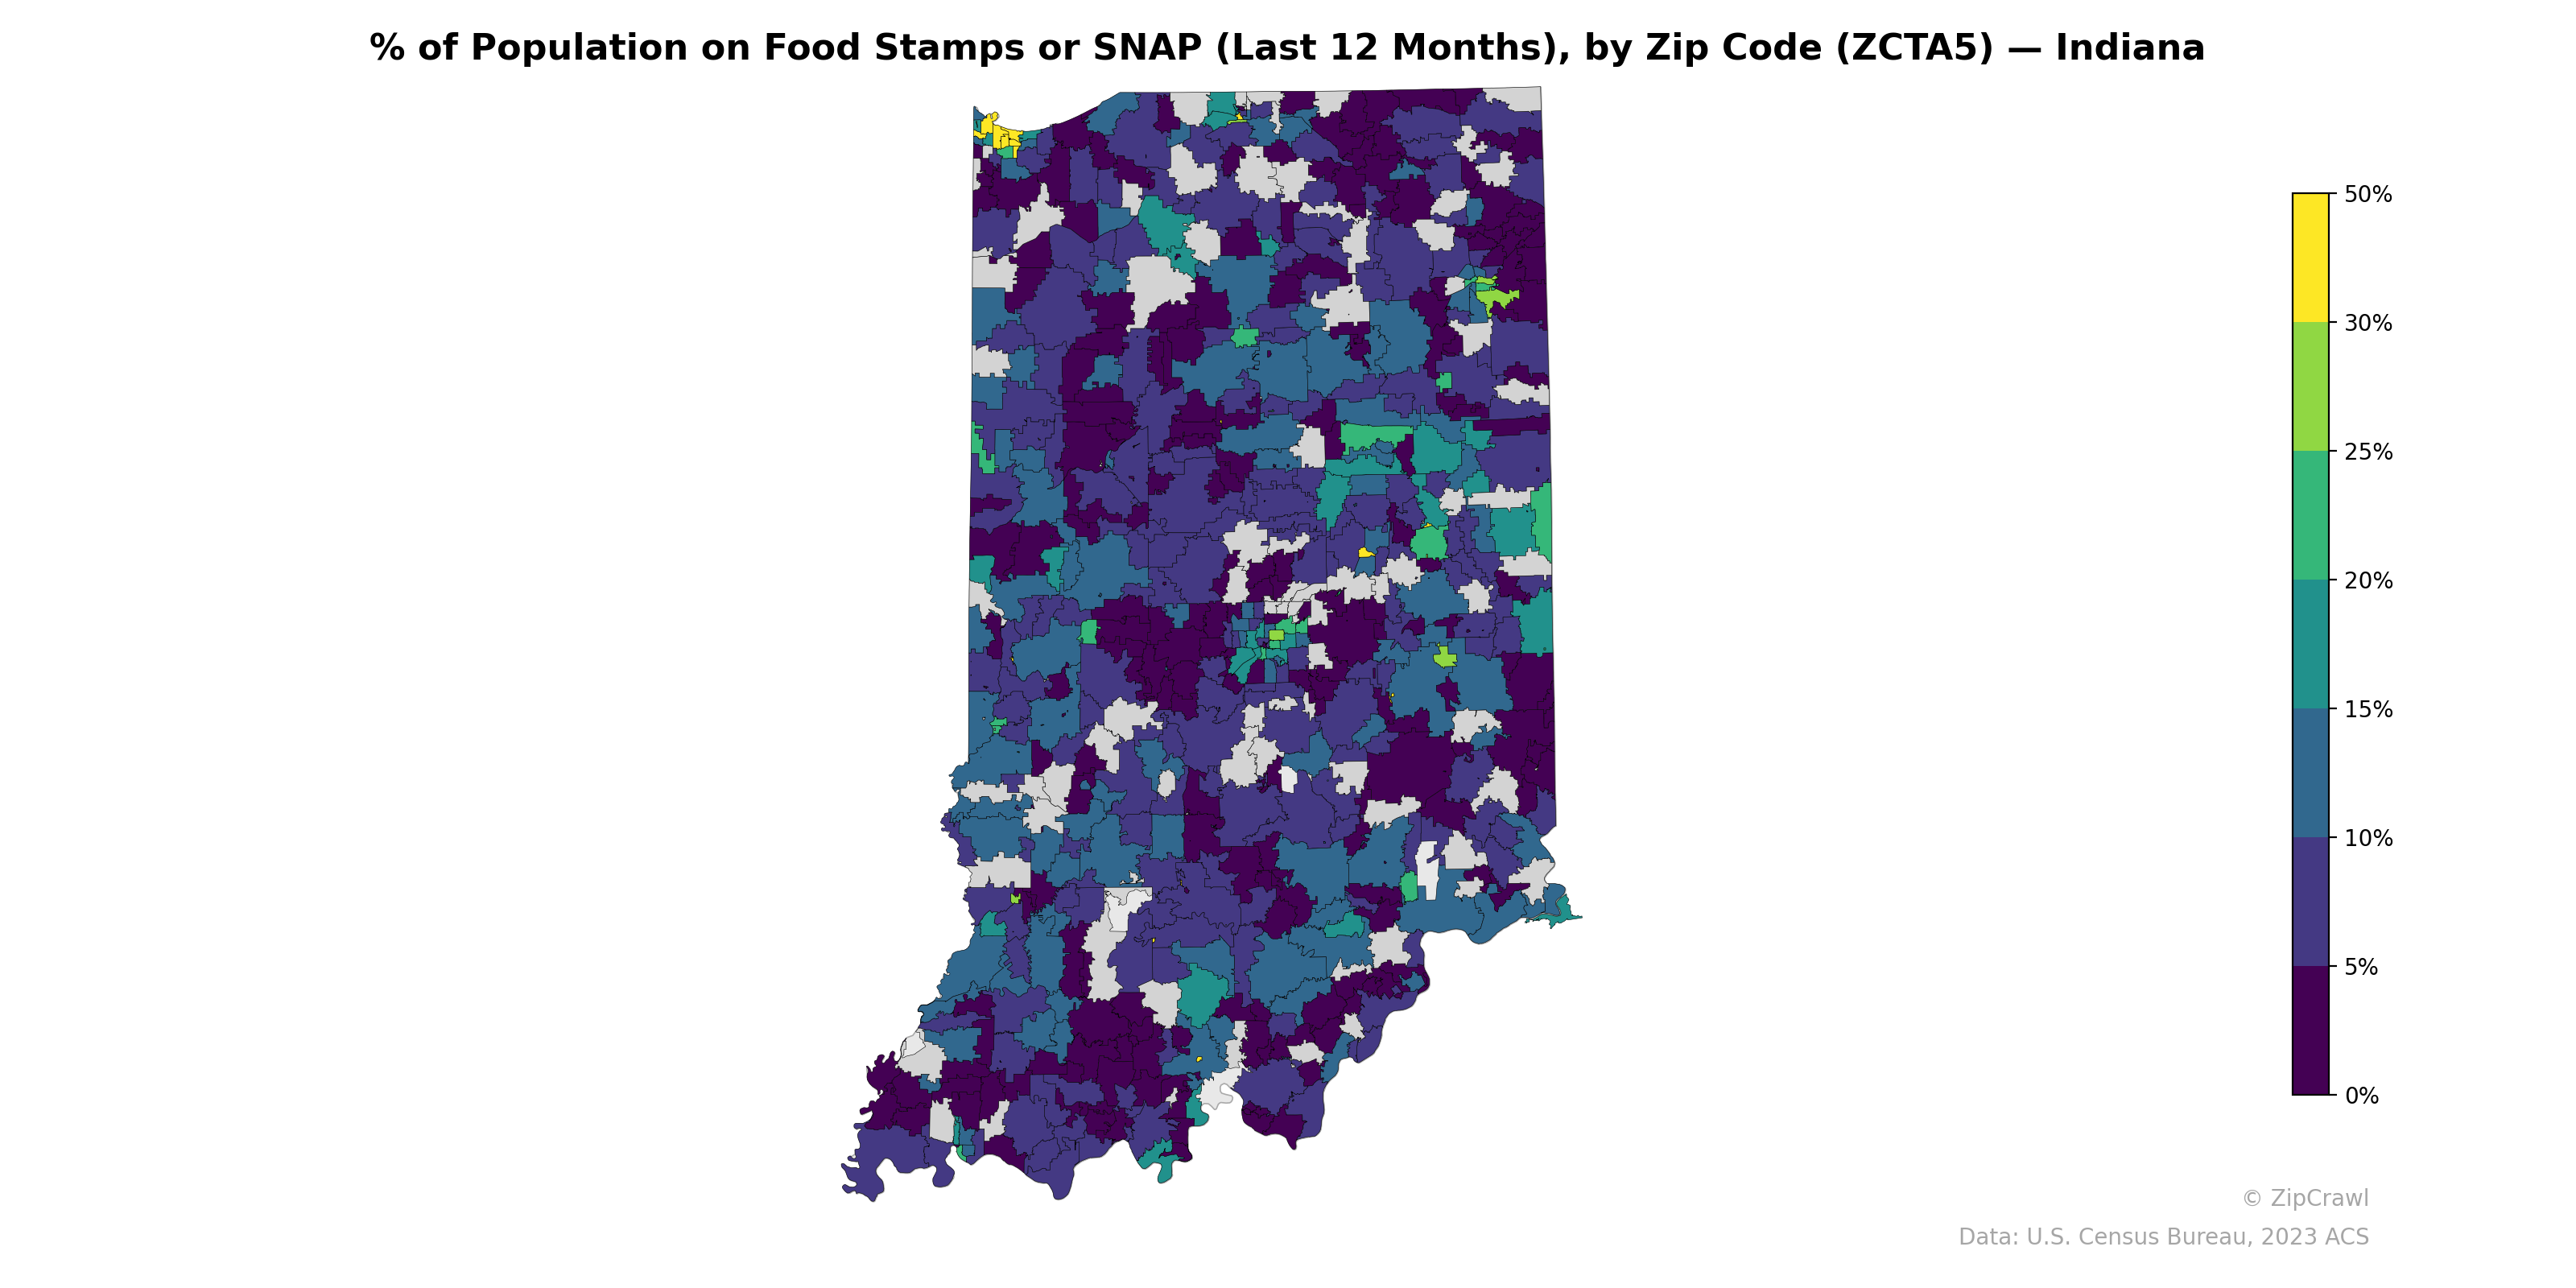
NOTE: Gray indicates insufficient data or a suppressed estimate.
Urban cores in Indianapolis, Gary/East Chicago, and several smaller cities like Muncie and Terre Haute display the highest SNAP participation rates, with some zip codes exceeding 30–50%, consistent with concentrated poverty in legacy industrial and metropolitan centers. Northern Indiana exhibits notable geographic contrast, with high-usage zip codes in the Lake County/Gary area sitting adjacent to substantially lower-rate suburban communities, while a similar urban-suburban gradient radiates outward from the Indianapolis metropolitan core. Southern Indiana generally trends toward moderate usage (10–20%) with pockets of higher participation along the Ohio River corridor and in rural Appalachian-adjacent counties, while many suburban and exurban zip codes throughout the state remain below 5%.
Data: U.S. Census Bureau, 2023 ACS
Explore
- Housing % of Units Built Since 2010, by Zip Code (ZCTA5) — Los Angeles Metro
- Population Hispanic % by Zip Code (ZCTA5) — Missouri
- Population Non-Hispanic Asian % by Zip Code (ZCTA5) — Indiana
- Population Non-Hispanic White % by Zip Code (ZCTA5) — Missouri
- Population Non-Hispanic Black % by Zip Code (ZCTA5) — Missouri
- Median Age by Zip Code (ZCTA5) — Missouri
- Population Non-Hispanic American Indian % by Zip Code (ZCTA5) — Missouri
- U.S. Citizens (% of Population Over 18) by Zip Code (ZCTA5) — Missouri
- Household Median Income by Zip Code (ZCTA5) — Missouri
- High School Graduate (% of Over 25) by Zip Code (ZCTA5) — Missouri
- High School Graduate (% of Over 25) by Zip Code (ZCTA5) — North Dakota
- Population Non-Hispanic Black % by County
- Housing Vacancy Rate by Zip Code (ZCTA5) — Los Angeles Metro
- Household Average Size by Zip Code (ZCTA5) — Los Angeles Metro
- Married Couple (% of all Households) by Zip Code (ZCTA5) — Los Angeles Metro
- Housing Owner-Occupied Median Value ($), by Zip Code (ZCTA5) — Los Angeles Metro
- Housing Owner-Occupied % of Units, by Zip Code (ZCTA5) — Los Angeles Metro
- Housing Median Monthly Rent ($), by Zip Code (ZCTA5) — Los Angeles Metro
- % of Households with Broadband Internet, by Zip Code (ZCTA5) — Los Angeles Metro
- Bachelor's Degree or Higher (% of Over 25) by Zip Code (ZCTA5) — Los Angeles Metro
- % of Population without Health Insurance, by Zip Code (ZCTA5) — Los Angeles Metro
- Housing Median Monthly Rent ($), by Zip Code (ZCTA5) — Tennessee
- Housing Owner-Occupied % of Units, by Zip Code (ZCTA5) — Tennessee
- Housing % of Units Built Since 2010, by Zip Code (ZCTA5) — Tennessee
- High School Graduate (% of Over 25) by Zip Code (ZCTA5) — Tennessee
- Population Non-Hispanic American Indian % by Zip Code (ZCTA5) — Tennessee
- High School Graduate (% of Over 25) by Zip Code (ZCTA5) — Wisconsin
- % of Population without Health Insurance, by Zip Code (ZCTA5) — Tennessee
- Housing Owner-Occupied Median Value ($), by Zip Code (ZCTA5) — Tennessee
- Bachelor's Degree or Higher (% of Over 25) by Zip Code (ZCTA5) — Tennessee
- % of Population on Food Stamps or SNAP (Last 12 Months), by Zip Code (ZCTA5) — Montana
- % of Population on Food Stamps or SNAP (Last 12 Months), by Zip Code (ZCTA5) — Louisiana
- % of Population on Food Stamps or SNAP (Last 12 Months), by Zip Code (ZCTA5) — Iowa
- % of Population on Food Stamps or SNAP (Last 12 Months), by Zip Code (ZCTA5) — Idaho
- % of Population on Food Stamps or SNAP (Last 12 Months), by Zip Code (ZCTA5) — Ohio
- % of Population on Food Stamps or SNAP (Last 12 Months), by Zip Code (ZCTA5) — Oregon
- % of Population on Food Stamps or SNAP (Last 12 Months), by Zip Code (ZCTA5) — Utah
- % of Population on Food Stamps or SNAP (Last 12 Months), by Zip Code (ZCTA5) — Maine
- % of Population on Food Stamps or SNAP (Last 12 Months), by Zip Code (ZCTA5) — Arizona
- % of Population on Food Stamps or SNAP (Last 12 Months), by Zip Code (ZCTA5) — Texas