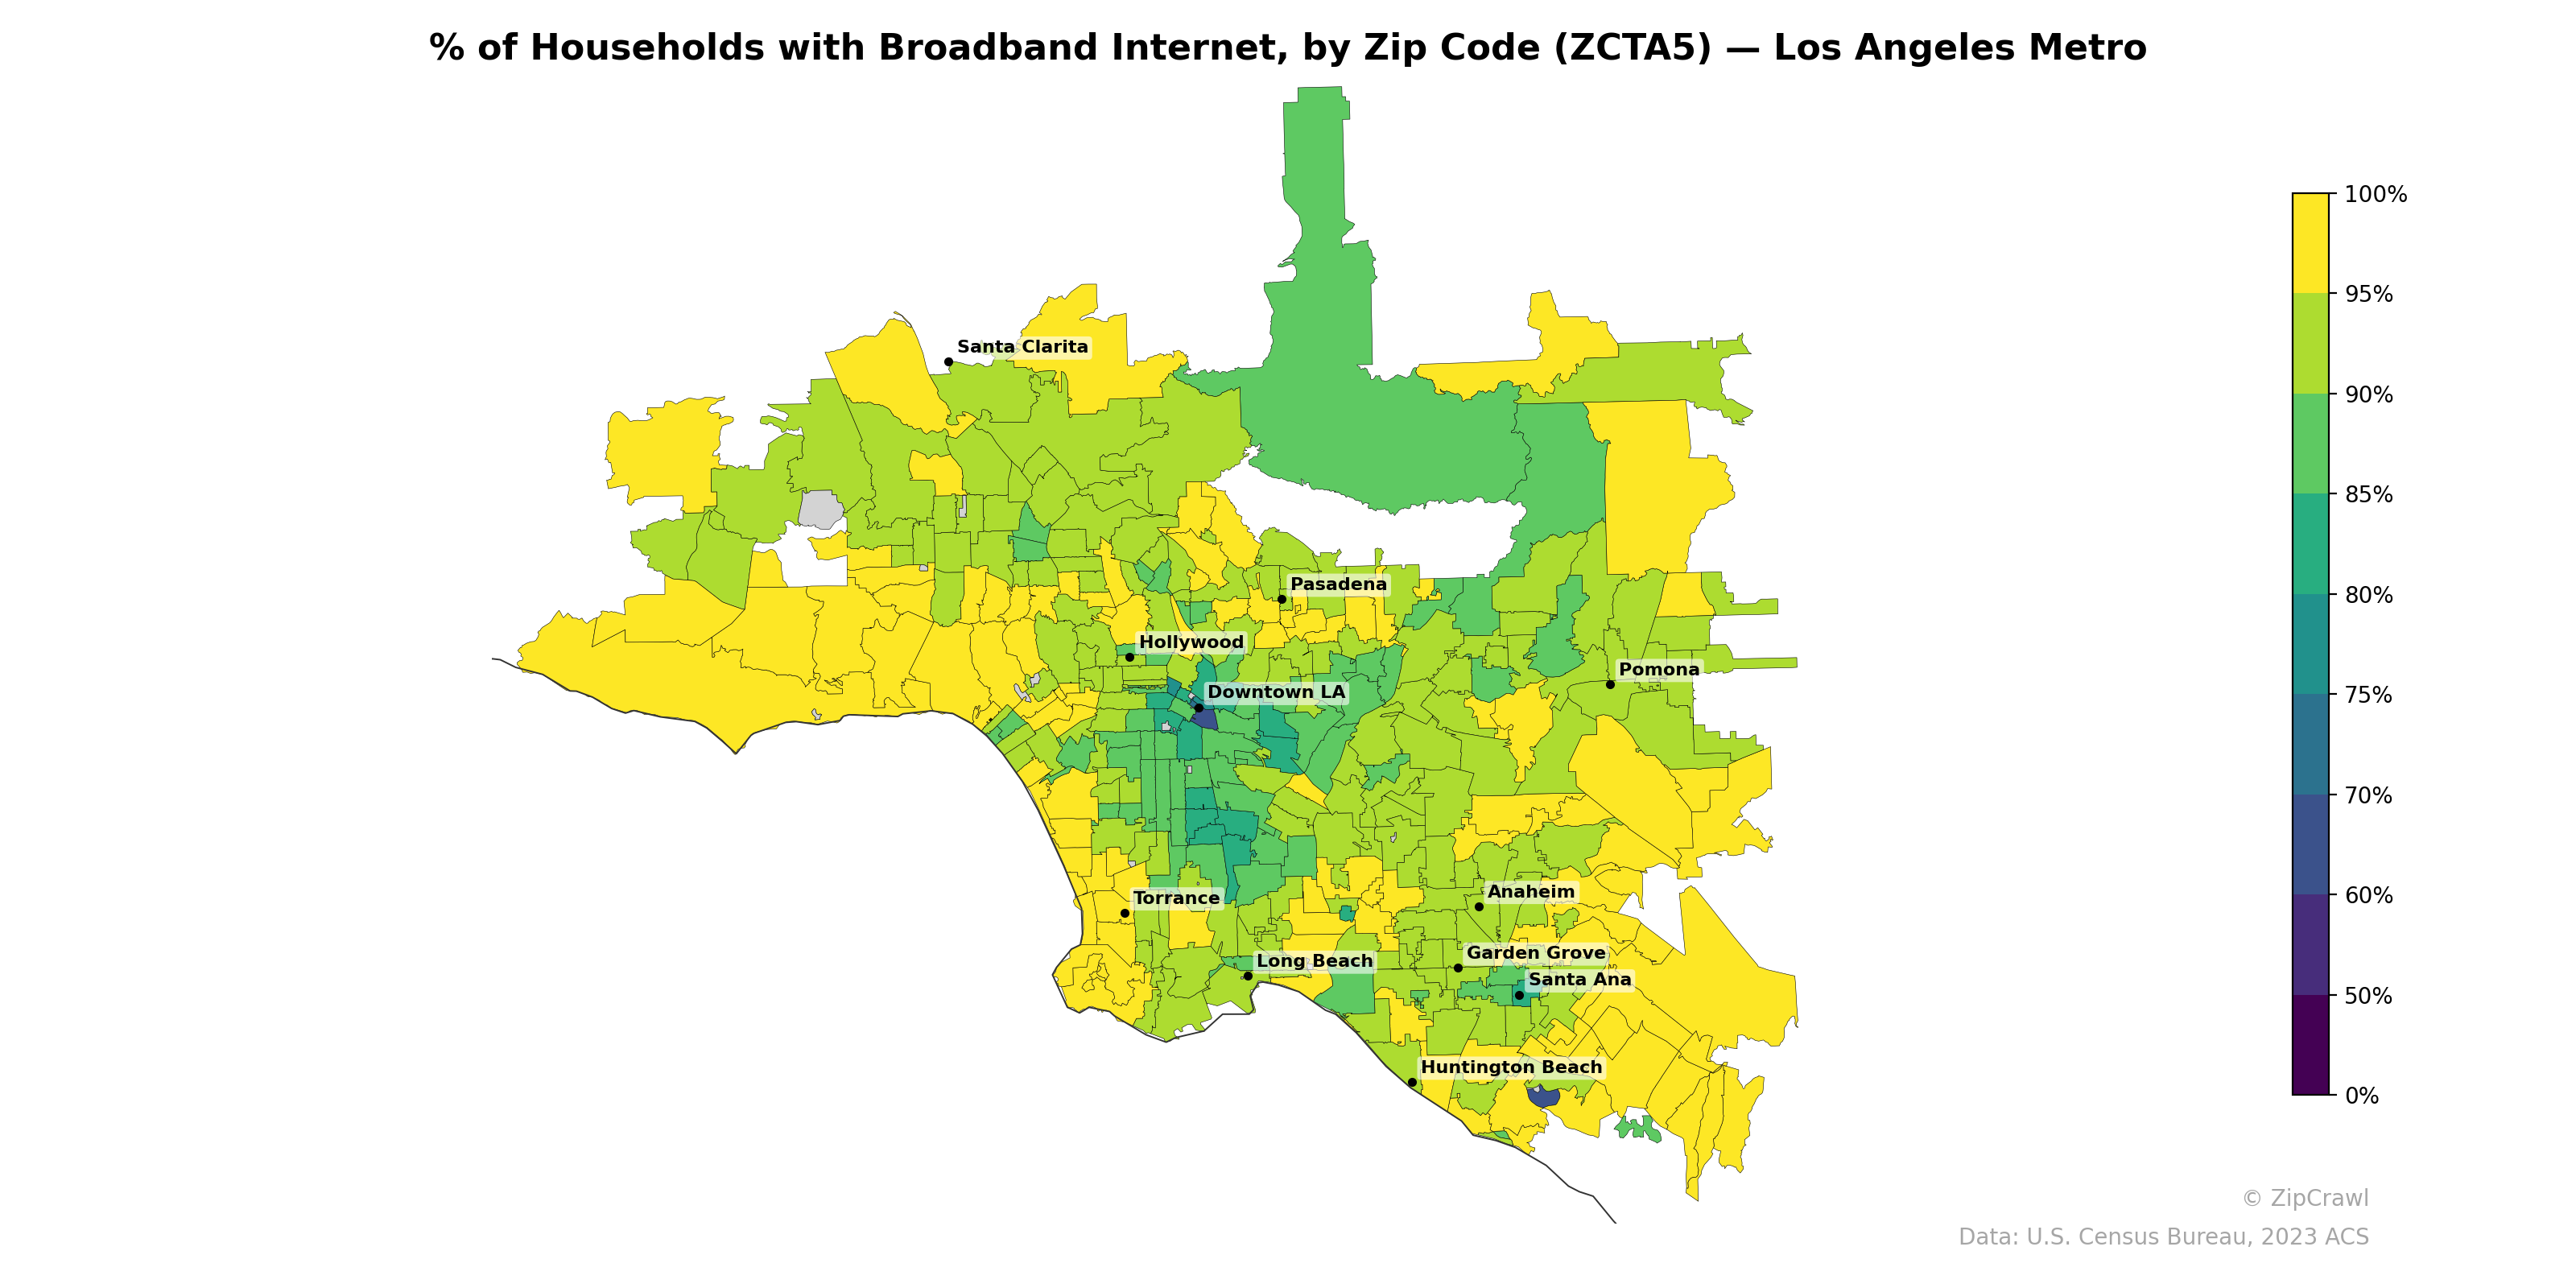
NOTE: Gray indicates insufficient data or a suppressed estimate.
Broadband adoption rates in the Los Angeles metro exhibit a clear spatial gradient, with affluent westside and foothill communities—particularly areas near Santa Clarita, the western San Fernando Valley, and coastal zones south of Torrance—consistently exceeding 90%, while a concentrated band of lower connectivity (roughly 60–75%) stretches through South Los Angeles, parts of Downtown LA, and into central Orange County around Santa Ana and Garden Grove. The eastern San Gabriel Valley and Pomona area display moderate but uneven coverage, with pockets of higher adoption interspersed among lower-access zip codes. A notable outlier appears in the southern tip of Orange County near the coast, where at least one zip code drops below 50%, likely reflecting a small or institutionally distinct population rather than typical residential patterns.
Data: U.S. Census Bureau, 2023 ACS
Explore
- Housing Owner-Occupied % of Units, by Zip Code (ZCTA5) — Tennessee
- Bachelor's Degree or Higher (% of Over 25) by Zip Code (ZCTA5) — Tennessee
- % of Population without Health Insurance, by Zip Code (ZCTA5) — Tennessee
- Housing Owner-Occupied Median Value ($), by Zip Code (ZCTA5) — Tennessee
- Housing % of Units Built Since 2010, by Zip Code (ZCTA5) — Tennessee
- Married Couple (% of all Households) by Zip Code (ZCTA5) — Tennessee
- Household Average Size by Zip Code (ZCTA5) — Tennessee
- Housing Vacancy Rate by Zip Code (ZCTA5) — Tennessee
- Housing Median Monthly Rent ($), by Zip Code (ZCTA5) — Tennessee
- Population Non-Hispanic Black % by County
- Married Couple (% of all Households) by Zip Code (ZCTA5) — Los Angeles Metro
- Housing Vacancy Rate by Zip Code (ZCTA5) — Los Angeles Metro
- Housing % of Units Built Since 2010, by Zip Code (ZCTA5) — Los Angeles Metro
- % of Population without Health Insurance, by Zip Code (ZCTA5) — Los Angeles Metro
- Bachelor's Degree or Higher (% of Over 25) by Zip Code (ZCTA5) — Los Angeles Metro
- Housing Owner-Occupied % of Units, by Zip Code (ZCTA5) — Los Angeles Metro
- Housing Owner-Occupied Median Value ($), by Zip Code (ZCTA5) — Los Angeles Metro
- Housing Median Monthly Rent ($), by Zip Code (ZCTA5) — Los Angeles Metro
- Household Average Size by Zip Code (ZCTA5) — Los Angeles Metro
- Population Non-Hispanic American Indian % by Zip Code (ZCTA5) — Tennessee
- Population Hispanic % by Zip Code (ZCTA5) — Tennessee
- Population Non-Hispanic White % by Zip Code (ZCTA5) — Tennessee
- Population Non-Hispanic Black % by Zip Code (ZCTA5) — Tennessee
- % of Population on Food Stamps or SNAP (Last 12 Months), by Zip Code (ZCTA5) — Arizona
- Population Non-Hispanic Asian % by Zip Code (ZCTA5) — Arizona
- High School Graduate (% of Over 25) by Zip Code (ZCTA5) — Tennessee
- U.S. Citizens (% of Population Over 18) by Zip Code (ZCTA5) — Tennessee
- Household Median Income by Zip Code (ZCTA5) — Tennessee
- Median Age by Zip Code (ZCTA5) — Tennessee
- Population Non-Hispanic Asian % by Zip Code (ZCTA5) — Tennessee
- % of Households with Broadband Internet, by Zip Code (ZCTA5) — Houston Metro
- % of Households with Broadband Internet, by Zip Code (ZCTA5) — St. Louis Metro
- % of Households with Broadband Internet, by Zip Code (ZCTA5) — Austin Metro
- % of Households with Broadband Internet, by Zip Code (ZCTA5) — Miami Metro
- % of Households with Broadband Internet, by Zip Code (ZCTA5) — Atlanta Metro
- % of Households with Broadband Internet, by Zip Code (ZCTA5) — Orlando Metro
- % of Households with Broadband Internet, by Zip Code (ZCTA5) — Tampa Metro
- % of Households with Broadband Internet, by Zip Code (ZCTA5) — Boston Metro
- % of Households with Broadband Internet, by Zip Code (ZCTA5) — Detroit Metro
- % of Households with Broadband Internet, by Zip Code (ZCTA5) — Chicago Metro